Summarizing Data with G_Functions
We can use a single G_Function to perform the exact same calculations as in our tabulation example.
g_sum(G;S;X). g_sum(G;S;X) is one of the most
basic G_Functions available in our function library. The three parameters it calls for are
available in every single G_Function. While the S parameter is very
important, we're going to omit it from our first example. Instead, we will simply provide
G and X in order to replicate our tabulation
results as closely as possible. In all G_Functions, G and
X represent the following:- G - is the column name that we will group our results by. In this case we are
still going to use the
storecolumn, as we did in our tabulation. - X - is the column name that we want our G_Function to act on. In this case we are still
going to use the
salescolumn.
g_sum(store;;sales)Notice that we are omitting the
S parameter, but still must separate it from the other parameters with
semi-colons. In order to actually apply this Value Expression to the table, we will need to
create a computed column. Go to and enter the Value Expression as shown in the screenshot below: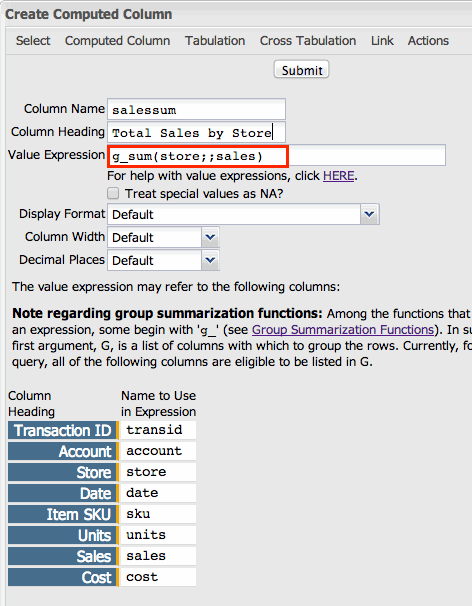
Once you click Submit, you will have a new column in your table that contains the total for each store, for each record from that store:
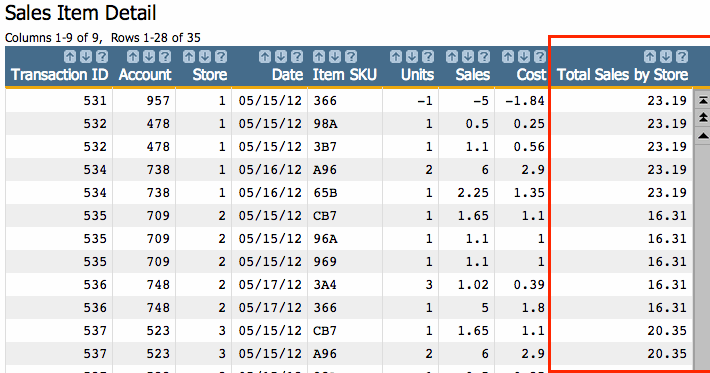
You should immediately notice two main differences here from the results of our tabulation. First, we still have all the information in the table we started with. This is a real advantage of G_Functions. They give you the ability of being able to see your summarization data while maintaining the granularity of your original table. This can be extremely valuable for calculations where each result in the new column might be different. However, in this example, we do need to see the total sales for the store for every single row. Which brings us to the second detail you may have noticed by now: g_functions don't re-format your data.
Depending on how you use G_Functions, a little extra effort to format your results may be required. However, G_Functions can also help us to this end. Since we only want to see one result for each store in our table, it would be helpful to be able to select the rows we want. However, we don't have a unique metric with which to do this. So we need to create one.
g_first1(G;S;O)
function. We'll only use the first parameter to produce our column. Go to and enter the following Value Expression:g_first1(store;;)as shown in the screenshot below:
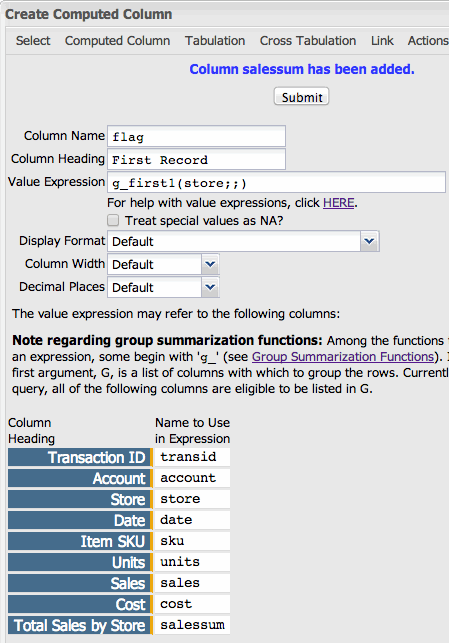
This will add another column to our table. Each time a store appears for the first time in the table, the corresponding value will be 1. If it isn't the first time a record for a given store has appeared, the corresponding value in the Selection Column will be 0. Let's see the results:
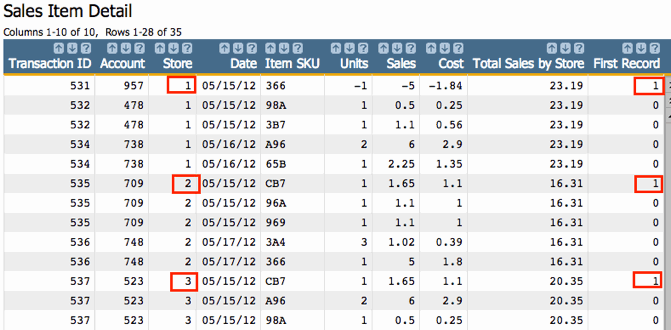 .
.
Now we're getting somewhere. Whereas before, we had no way to select rows to reduce our
results to the minimum requirement, we can now do exactly that. Go to and select on: flag=1. By selecting this way, we will have
the following results:

Next, let's look at one more example. This time, we're going to also utilize the
S parameter of g_sum(G;S;X).
The S parameter provides a way for you to filter which rows the
G_Function will operate on. Just as we created a selection column to ultimately filter which
rows of the summary we viewed in the last example, G_Functions can look at a selection row to
know whether or not they should include a specific row in a calculation. As an example, let's
say that we want to summarize the sales of stores 1 and 3 in our table, but exclude store 2.
This is easy to do with the combination of G_Functions that are given a selection column as a
parameter. But in order to do that, first, we have to create the selection column.
store=1 3as shown in the screenshot below:

The result will be a column where 1 is the value for rows within the definition of the column (i.e., stores 1 and 3) and 0 for those outside the definition (i.e., store 2).
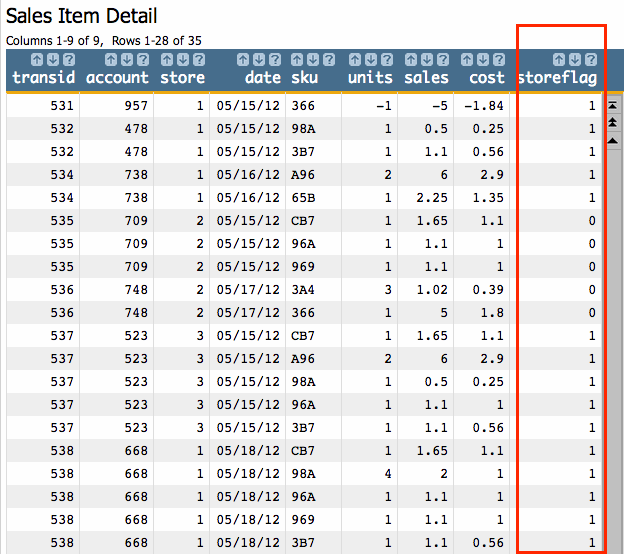
storeflag column shown above as the
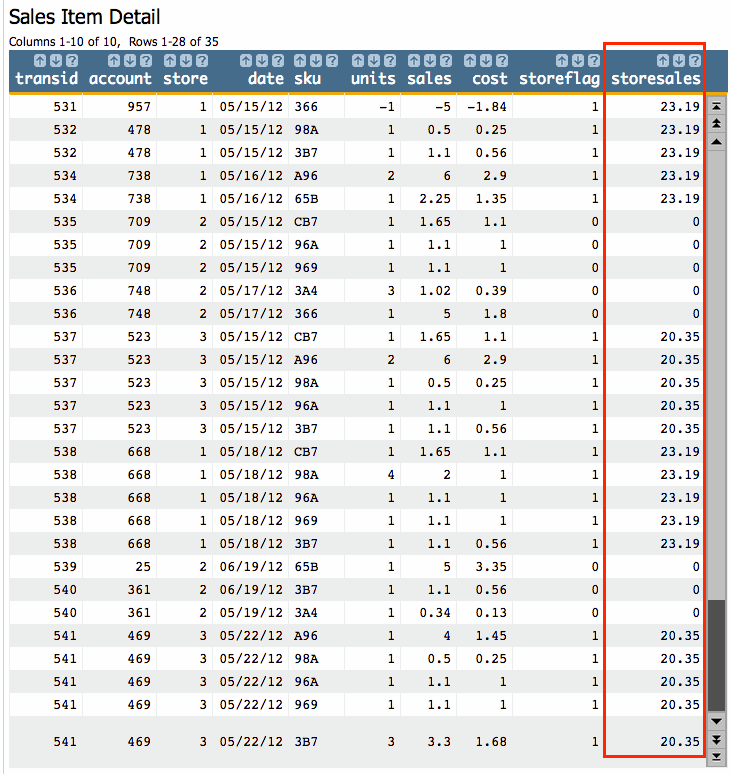
S parameter in the g_sum(G;S;X) function, as
follows:g_sum(store;storeflag;sales)
Create a Computed Column and enter the above value expression. Your result will look like this:
g_first1(G;S;O) function again, only this time we'll also include our
selection column in the S
parameter:g_first1(store;storeflag;)
Here are the results with the new Computed Column:
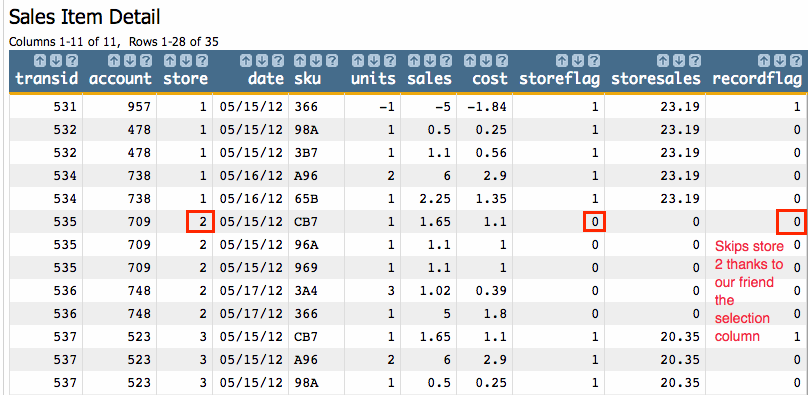
recordflag=1

As you can see, G_Functions are specially designed to quickly perform calculations through entire tables. For ease of illustration we used a very small data table where the efficiencies of G_Functions are less important. However, when working on very large data sets you will find that G_Functions are often the best tool at your disposal for data summaries. In the next section we'll delve into the reasons why.
