
Basic usage
This section shows how to perform basic operations on the TenFrame.
We discuss tenFrame basics such as starting a session, creating a TenFrame from a 1010data table, subsetting rows and columns, computing new columns, aggregating data, and joining tables.
Opening a table
To open a table, you must supply the TenFrame object with a py1010 Session object and a 1010data table to open.
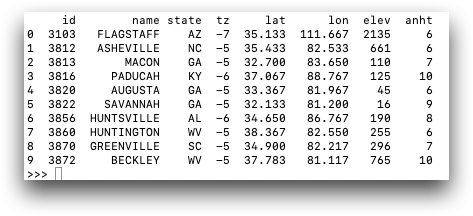
The following example creates a simple TenFrame object for the table
pub.demo.weather.stations:
import py1010
import tenFrame as tf

session = py1010.Session("1010data URL", "USERNAME", "PASSWORD", py1010.POSSESS)
stations = tf.TenFrame(session, "pub.demo.weather.stations")
print(stations)
1010data URL is the gateway and version you use to access
1010data. USERNAME and PASSWORD are the user name
and password you use to access 1010data.First, import py1010, 1010data's Python library, and then import tenFrame. Next,
start a session with the py1010 Session object. You can then create a TenFrame
object stations based on the session and the table
pub.demo.weather.stations.
As mentioned above, stations is the resulting TenFrame object, which
in the example above is based on the pub.demo.weather.stations
table.
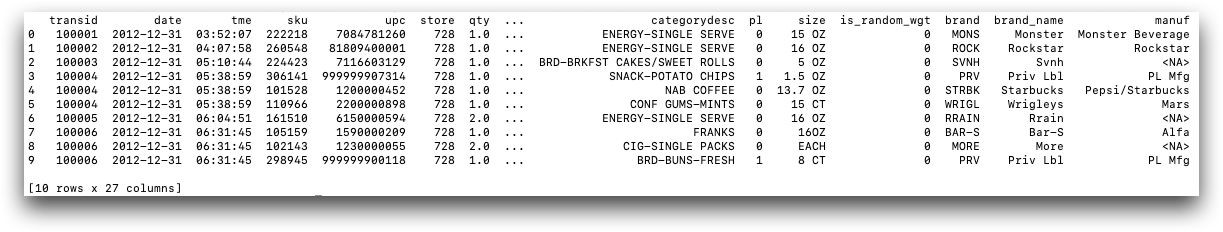
You can print stations to return a representation of the TenFrame
object, or the first 10 entries of the table.
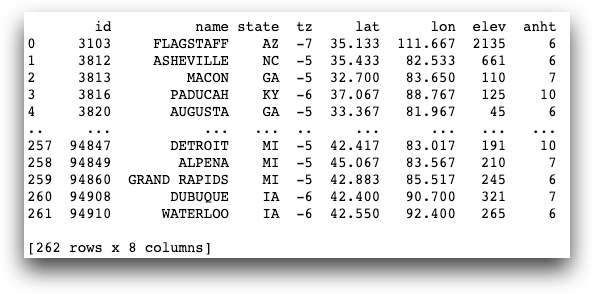
to_df()
function:dstations = stations.to_df() print(dstations)You will see that pandas works similarly, although pandas displays the first and last few rows of a long frame and the number of rows and columns at the bottom, as follows.
Getting basic table statistics
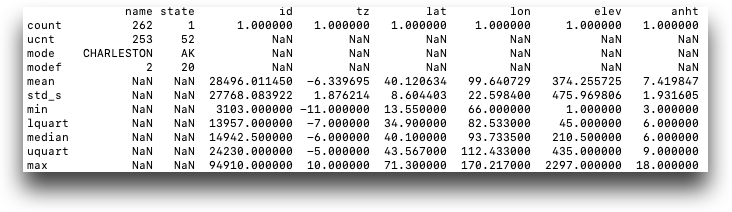
.describe() method is
similar to the one in pandas. It returns a pandas DataFrame with the following
statistics for all the numeric columns in the table: - count
- mean
- std
- min
- lquart
- median
- uquart
- max
include is set to all, the following rows are
added for all string columns:- count of unique values
- mode
- frequency of mode
stations = tf.TenFrame(session, "pub.demo.weather.stations")
print(stations.describe(include='all'))
Subsetting rows
You can subset rows in tenFrame similarly to subsetting rows in pandas.
Once you have a TenFrame object, you can subset rows to refine the data.
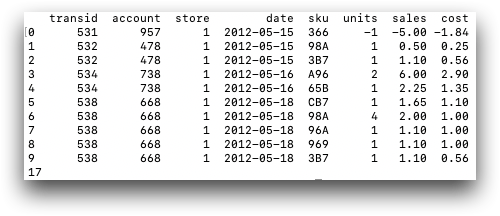
retailitem
based on the session and the pub.demo.retail.item table. Then, we
can perform simple operations on the table, such as returning the results of store 1
only. You can use len() to return the number of rows in the
selection
(17).import py1010 import tenFrame as tf session = py1010.Session("1010data URL", "USERNAME", "PASSWORD", py1010.POSSESS) retailitem = tf.TenFrame(session, "pub.demo.retail.item") print(retailitem[retailitem.store == 1]) print(len(retailitem[retailitem.store == 1]))
The following are additional ways you can subset rows in tenFrame:
| Notation | Description | Example |
|---|---|---|
frame[value1:value2] |
Slice of data from value1 to value2. | sales[3:1000] |
frame[condition] |
Subset data that meets a certain condition | sales[sales.qty > 19] |
frame.sample(frac) |
Subset a random sample of the data | sales.sample(frac=1e-4) |
frame.head(n),
frame.tail(n) |
Subset first/last rows | sales.head(n) |
Subsetting columns
You can subset one or more columns of a TenFrame much as you would subset one or more columns of a DataFrame in pandas.
When you subset a single column of a TenFrame, such as
stations['id'] it yields a TenSeries, but when you subset more
than one column, or even a list of a single column, such as stations[['id',
'state']] or stations[['id']], it yields a
TenFrame.
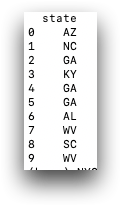
If you subset by a string, tenFrame returns the column of that name which is in the
frame. In the following example, stations['state'] evaluates to the
state column, and the first few values of it are printed
out.
import py1010
import tenFrame as tf

session = py1010.Session("1010data URL", "USERNAME", "PASSWORD", py1010.POSSESS)
stations = tf.TenFrame(session, "pub.demo.weather.stations")
print(stations['state'])
stations[['id','name','state']]
It is possible to use the * wildcard character to subset multiple columns. For
example, baseball[["birth*"]] is the same as
baseball[["birthmonth", "birthday", "birthyear"]].
stations.state, but to set a new column, you must use brackets,
as
follows:sales['margin'] = sales.xsales - sales.costThe new column margin is in brackets, while the existing columns
xsales and cost are attributes. See Computing
new columns for more information.
tenFrame, unlike pandas, allows you to subset by an integer.
stations[2] is the same as stations['state']
for the stations TenFrame.
Computing new columns
You can assign one new column to a TenFrame or assign several new columns at once in a new TenFrame.
retailitem['margin'] = retailitem.sales - retailitem.costThe
following example uses the retaildemo.retail.sales_detail
table.
import py1010
import tenFrame as tf

session = py1010.Session("1010data URL", "USERNAME", "PASSWORD", py1010.POSSESS)
sales = tf.TenFrame(session, "retaildemo.retail.sales_detail")
sales['margin'] = sales.xsales - sales.cost
print(sales)
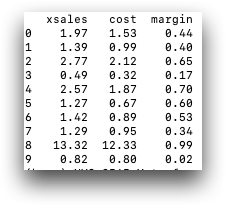
Remember, in tenFrame, the new column is not computed until you access the data.
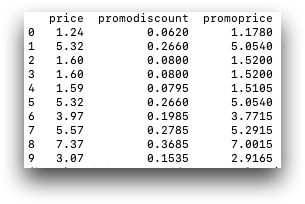
assign(), as follows:promo2 = promo.assign(promodiscount=promo.price * 0.05, promoprice = promo.price - (promo.price * 0.05)) print(promo2[['price', 'promodiscount', 'promoprice']])
Manipulating dates and times
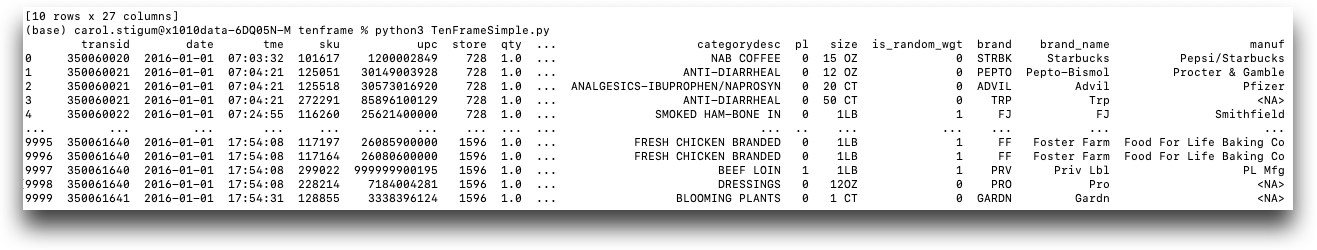
1010data stores dates differently from pandas. In 1010data, there are no real "date" or "time" types. Dates are stored as integers, giving the year, month, and day in the following format: YYYYMMDD. For example, 1010data stores the date 3/25/2022 as the integer 20220325. Datetimes are stored as floating-point numbers counting the number of days and fractions of a day since a known fixed date. Dates and times are covered extensively in the 1010data Reference Manual, in the Dates and time topic.
products
table:import datetime sales = sales[((datetime.date(2016,1,1) <= sales.date) & (sales.date < datetime.date(2017,1,1)))] salesprod = tf.merge(sales, "retaildemo.retail.products", on="sku") print(salesprod)
Aggregating data
Aggregation in tenFrame is similar to pandas aggregration.
You can use the groupby() method, along with
aggregation functions, to aggregate data that is grouped by the values of one or
more columns.
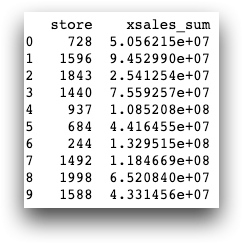
The following code groups sales by store, and then uses sum() to
aggregate the total sales by store.
import py1010
import tenFrame as tf

session = py1010.Session("1010data URL", "USERNAME", "PASSWORD", py1010.POSSESS)
retailitem = tf.TenFrame(session, "retaildemo.retail.sales_detail")
aggsales = retailitem.groupby('store')[['xsales']].sum()
print(aggsales)
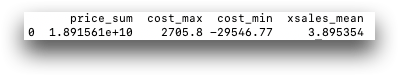
You can use the agg() method for more complex
aggregations, such as aggregating multiple columns in different ways at the same
time, as follows:
sales.agg({"price":"sum", "cost": ["max", "min"], "xsales":"mean"})
Note that tenFrame aggregations are always TenFrames containing the group columns (if
any) and the result, while in pandas an aggregation such as
df.col.sum() is a Series, labeled with the index, and not a
DataFrame.
There is a large library of 1010data functions available to aggregate data. The 1010data Reference Manual contains a complete list of tabulation and group functions. The following is a sameple:
| Function | Description | Example |
|---|---|---|
sum() |
Sum | sales.xsales.sum() |
count() |
Count of N/A values | sales.customer_key.count() |
median() |
Median | sales.qty.median() |
min() |
Minimum | sales.xsales.min() |
max() |
Maximum | sales.xsales.max() |
mean() |
Mean | sales.xsales.mean() |
var() |
Variance | sales.cost.var() |
std() |
Standard Deviation | sales.price.std() |
max(), min(), and
mean()) have different names as 1010data functions. tenFrame
automatically converts them to the more familiar pandas function names.Adjoining aggregations
groupby() column(s),
tenFrame accomplishes aggregations without time-consuming joins. Adjoining returns a
new TenFrame, not a TenSeries to assign into an existing TenFrame. Most adjoined
aggregations result in a table that is shorter than the original data. You still use
the groupby() method, but in the aggregation function, you would
set adjoin=True, as
follows:frame_sums = frame.groupby("month").sales.sum(adjoin=True, name="monthly_sales")
The name parameter is optional, and if omitted, the default column
name would be sales_sum.
The following example shows how to use adjoining aggregations to find the mean elevation of weather stations by state:
stations = tf.TenFrame(session, "pub.demo.weather.stations")
stations.groupby("state").elev.mean(adjoin=True)
stations
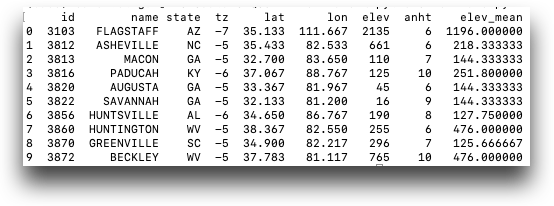
adjoin=True keeps all the rows of the table, instead of just
providing a mean elevation once for each state (note the three GA rows and the two
WV rows). If the table is properly segmented, tenFrame accomplishes this without a
join, and performs the calculation quickly. This is useful when you want to perform
aggregations, but you want to retain the granularity of the original data. In
pandas, you cannot do this type of aggregation without a time-consuming join (the
.merge() method).
Creating pivot tables
The tenFrame pivot_table() method works
approximately like the corresponding pandas method. It creates a spreadsheet-style
pivot table as a TenFrame. If you are familiar with 1010data, these are also
referred to as cross tabulations.
The basic syntax of the pivot table is as follows:
pvt = frame.pivot_table(values, index, column, aggfunc="mean", rename=True)
In a pivot table, values become column names. While pandas column names are unrestricted, 1010data columns have restrictions, such as beginning with a letter and consisting of only lower case letters, numbers, and underscores. tenFrame does its best to rename columns using these restrictions, but you should be aware that tenFrame may need to rename columns.
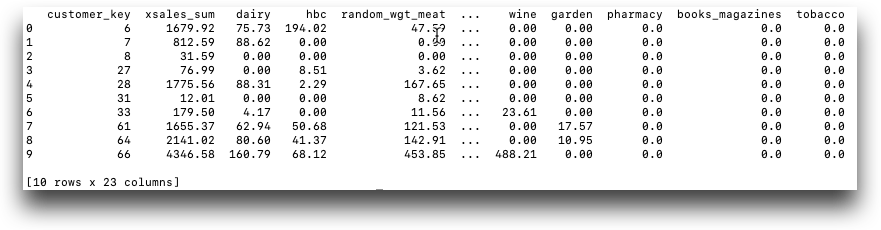
In the following example, the TenFrame cust_sales_2019 filters the
cust_sales TenFrame to contain the sales of 2019 only. We merge
cust_sales_2019 with products to form the
TenFrame cust_sales_2019_with_deptdesc. (See Joining
TenFrames for more details.) Finally, we create the TenFrame
cust_by_deptdesc. cust_by_deptdesc is a pivot
table with the following parameters:
xsalesis the column to aggregate (total sales)customer_keyis the column to group bydeptdescis the column to use for the pivot table's column namessumis the aggregating function
import py1010
import tenFrame as tf
session = py1010.Session("1010data URL", "USERNAME", "PASSWORD", py1010.POSSESS)
cust_sales = tf.TenFrame(session, "retaildemo.retail.sales_detail_customer",
    meta=['alloc_rr=20','nomaxtabu','nomaxtabc'])
products = tf.TenFrame(session, "retaildemo.retail.products")
cust_sales_2019 = cust_sales[cust_sales.date.year() == 2019]
cust_sales_2019_with_deptdesc = cust_sales_2019.merge(products, on='sku')
cust_by_deptdesc = cust_sales_2019_with_deptdesc.pivot_table('xsales', 'customer_key', 'deptdesc', 'sum')
print (cust_by_deptdesc)
Joining TenFrames
The merge() method in tenFrame is
similar to the pandas merge() method.
You can use the merge() method to join two TenFrames. The basic
syntax is tf.merge(frame1, frame2, on=column). This is similar to
the pandas syntax. You can also call merge() as a method on a
TenFrame. In that case, the syntax is frame1.merge(frame2).
retailitem and
productdetail, on the column sku. By default,
tenFrame performs a "left" join.import py1010 import tenFrame as tf session = py1010.Session("1010data URL", "USERNAME", "PASSWORD", py1010.POSSESS) retailitem = tf.TenFrame(session, "retaildemo.retail.sales_detail") productdetail = tf.TenFrame(session, "retaildemo.retail.products") mergedtable = tf.merge(retailitem, productdetail, on="sku")
merge() is just a table, you can use a
string naming the table instead of making a TenFrame for it, for
example:frame1.merge("retaildemo.retail.products", on="sku")
or
tf.merge(frame1, "retaildemo.retail.products", on="sku")
Concatenating TenFrames
concat() method is similar to
the one in pandas. concat() adds rows (with
axis=0, the default value) or columns (with
axis=1). If you are appending rows, the two TenFrames should have
the same number of columns. If you are joining by columns, the added TenFrame cannot
be a worksheet. In 1010data terms, a worksheet is a 1010data query whose data has
all been brought into the
accum.newframe = frame1.concat(frame2, axis=0)newframe is simply the rows of frame1 followed by
the rows of frame2.
Using group functions (g_functions)
If you are an experienced user of the 1010data macro language, you are probably already familiar with group functions, or g_functions. If not, you may want to review the Group functions section of the 1010data Reference Manual. Group functions are a special kind of grouping function that have an important limitation: you can use them only if your table is segmented in some way appropriate to your aggregation, or if your table is a single segment of fewer than 8 million rows. If you are able to use g_functions instead of a tabulation, g_functions are significantly faster. g_functions also allow you to create ordered aggregations.