Quick start#
If you are familiar with pandas, you can get up and running with TenFrame in about 10 minutes.
Note
The examples in this section are created in Jupyter Notebook, with iris installed.
To start using TenFrame, import py1010 and tenFrame as follows:
import py1010
import tenFrame as tf
Opening a 1010data table and creating a TenFrame#
To create a TenFrame, start a 1010data session and base the TenFrame on a 1010data table. The following example creates a TenFrame object retailitem based on a 1010data session and the table pub.demo.retail.item.
session = py1010.Session("1010data URL", "USERNAME", "PASSWORD", py1010.POSSESS)
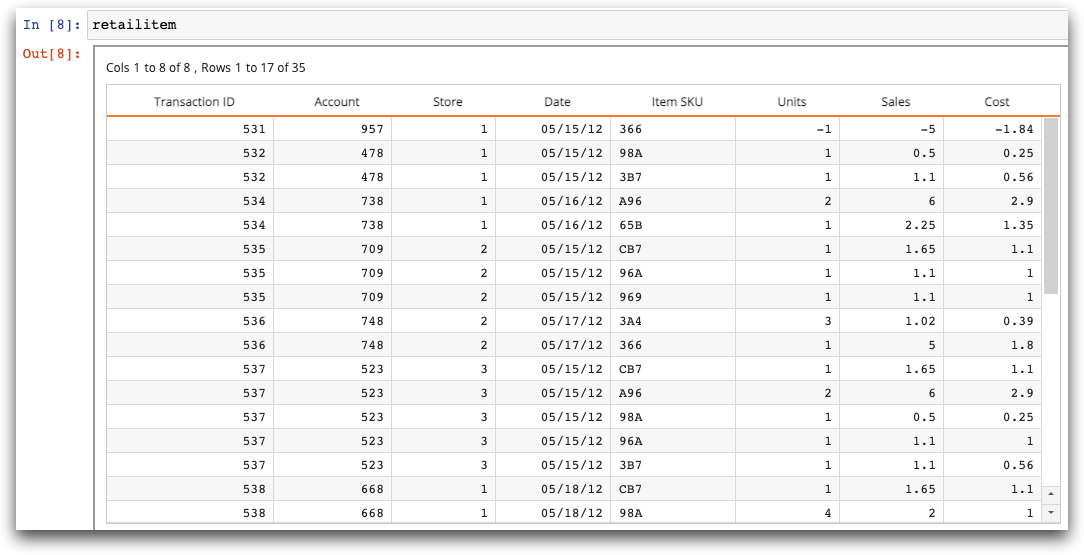
retailitem = tf.TenFrame(session, "pub.demo.retail.item")
Note
1010data URL is the gateway and version you use to access 1010data. USERNAME and PASSWORD are the user name and password you use to access 1010data.
Viewing the TenFrame#
In Jupyter Notebook, you can view the entire TenFrame in a grid:
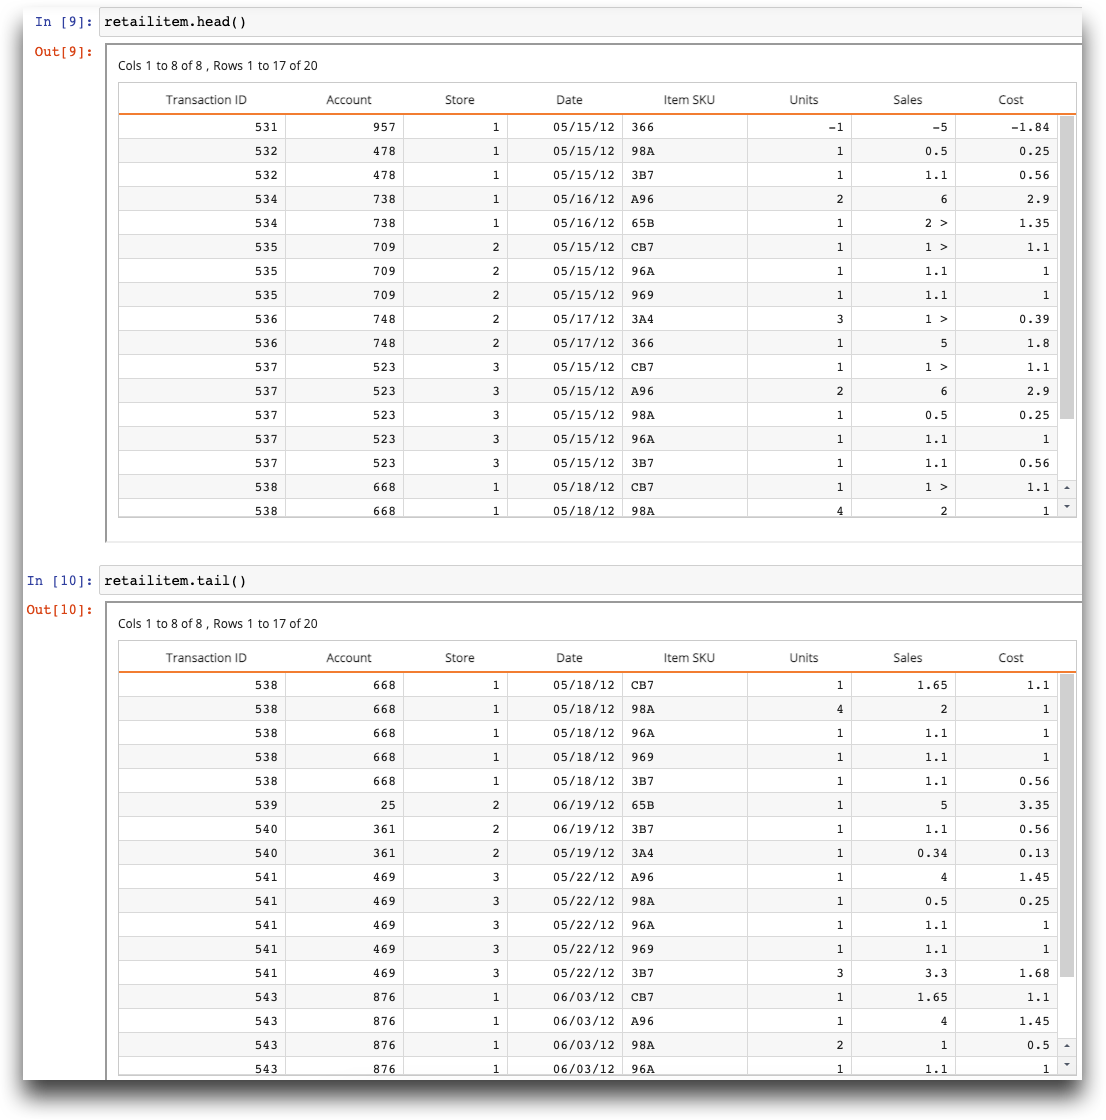
You can also use the .head() and .tail() methods to view the top and bottom rows of the TenFrame, respectively:
To download all your data, use .to_df() to convert the TenFrame to a pandas DataFrame (image truncated):
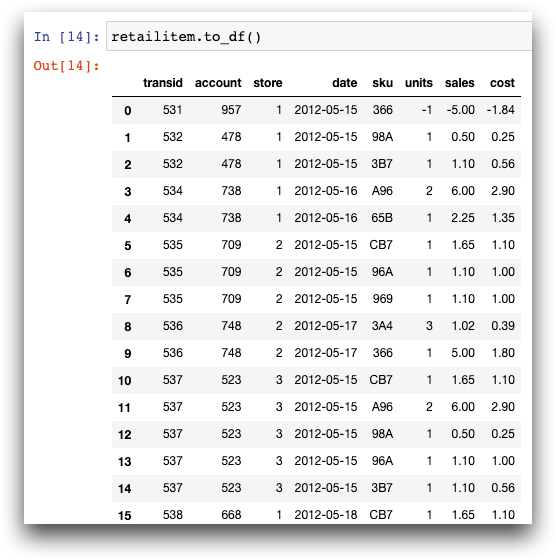
By default, to_df() downloads a maximum of 10000 rows of the table. If you want more rows, you would need to specify, for example, to_df(100000).
Most likely, you will not want to download all the data in the TenFrame.
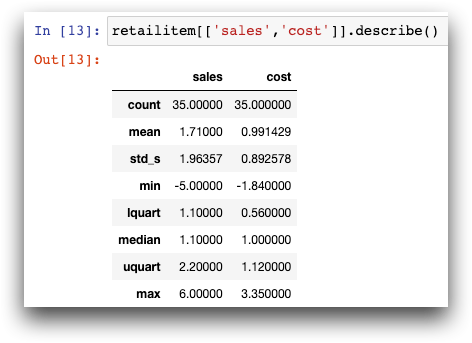
Use .describe() to get basic statistics for your TenFrame (in this example just the sales and cost columns):
Selecting data#
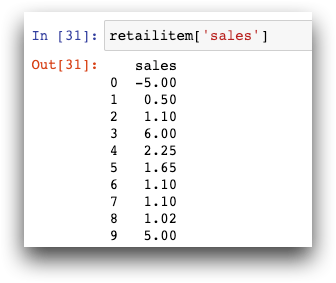
You can select a single column, which yields a TenSeries:
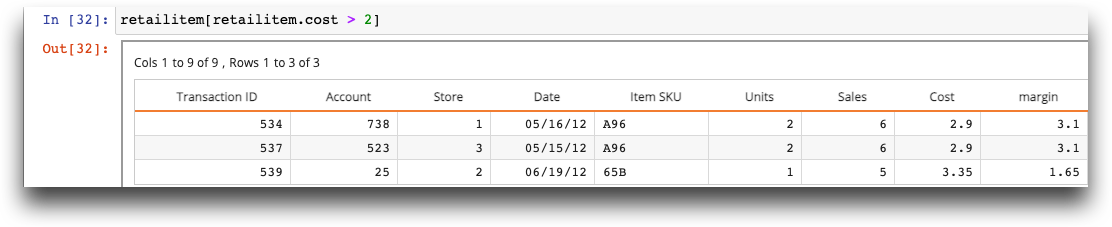
You can select rows of data using an expression:
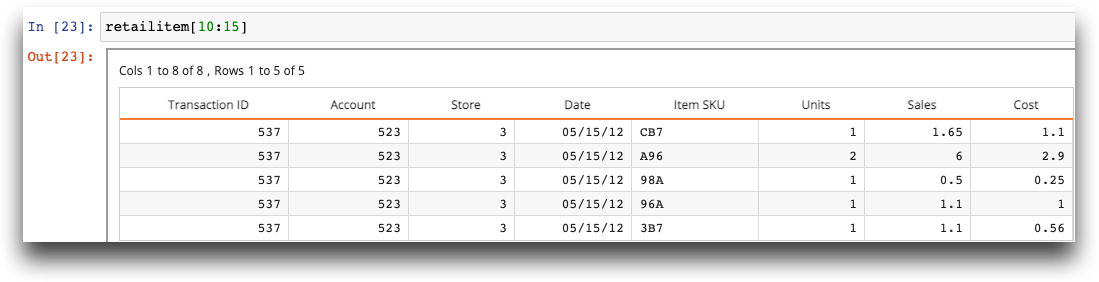
You can also select a “slice” of rows:
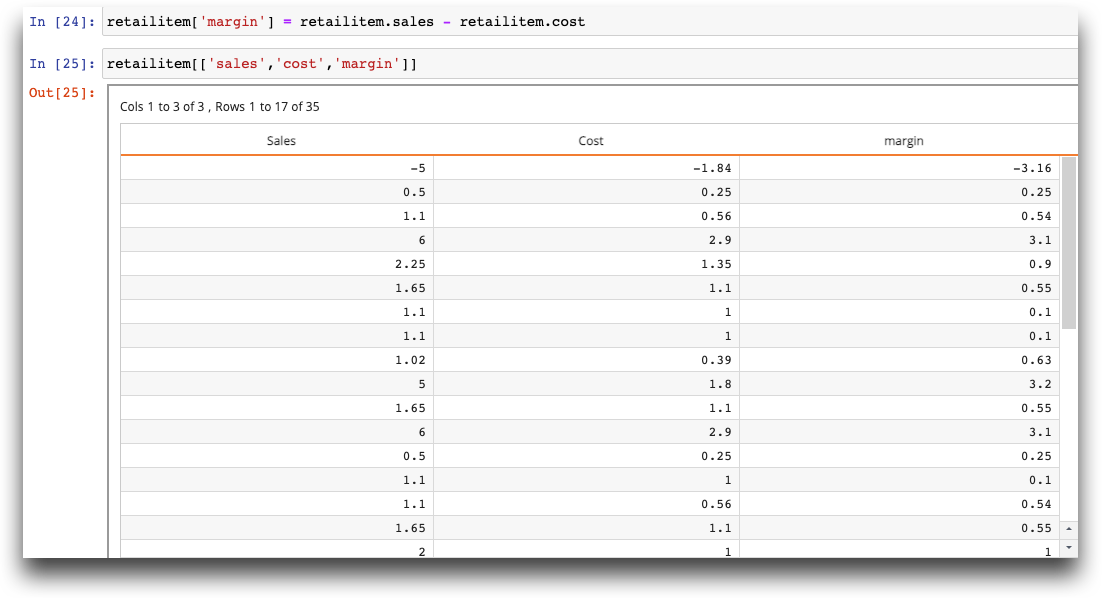
Calculating new data and subsetting columns#
Place the new column name in brackets and add an expression to create a calculated column. You can also subset the desired columns, in this case, sales, cost, and margin:
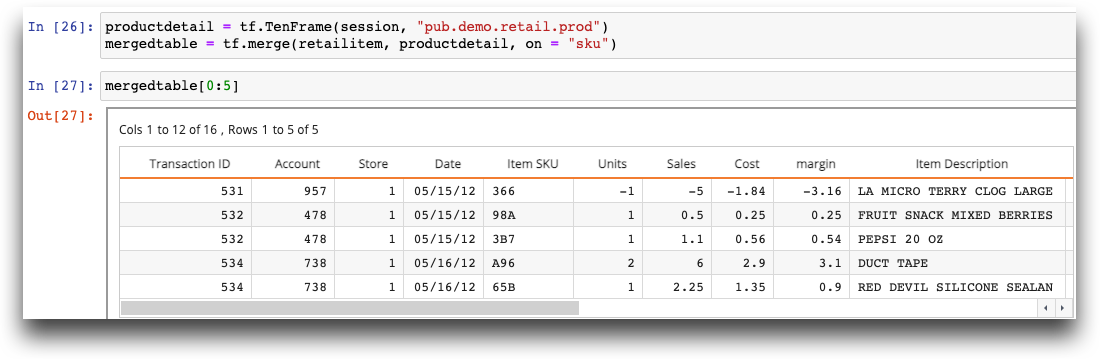
Combining TenFrames#
You can combine TenFrames in several ways.
Merge TenFrames on a column using a left join, in this case, using the sku column to merge a transaction TenFrame with a product detail TenFrame:
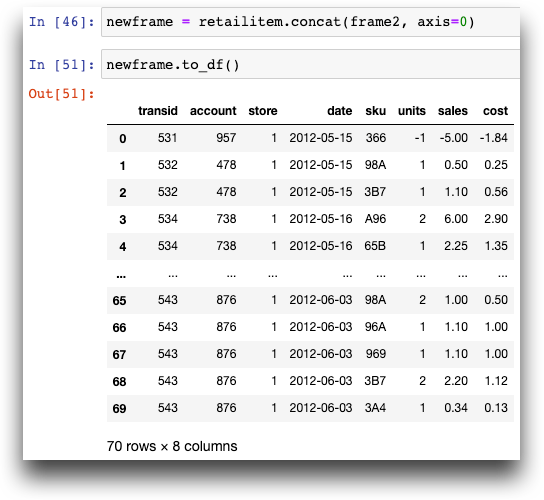
Concatenate TenFrames together by either appending the rows (axis=0) or columns (axis=1):
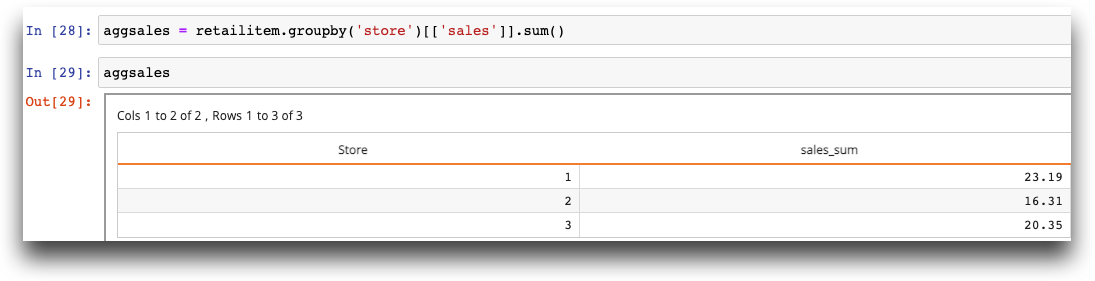
Grouping data#
Use the groupby() method to indicate the group(s) to aggregate. Then you can use aggregation functions, such as .sum(), to aggregate data of one or more columns:
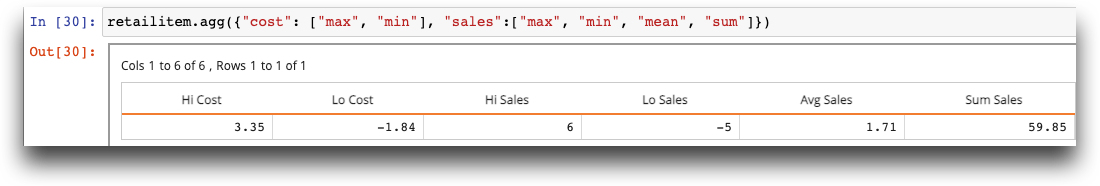
The .agg() function allows you to do more complex aggregations on multiple columns:
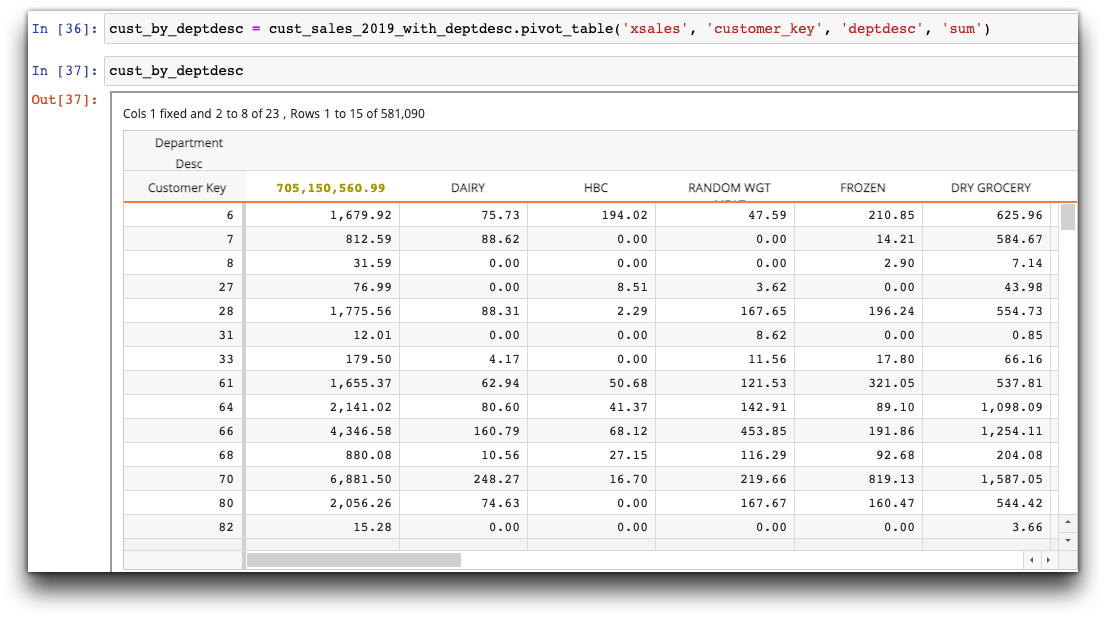
Creating a pivot table#
Use the pivot_table() method to create a pivot table. A pivot table (or cross tabulation, in 1010data terms) allows you to calculate the values in a column based on the values in two or more other columns and display the result as a matrix. The following pivot table groups the total sales by customer key, and also provides the sales breakdown for each department: