Retail analysis examples#
This section presents basic examples of retail data, to show how familiar it is for Python users, and to demonstrate performance on a large dataset.
To perform TenFrame operations on retail data, first import the py1010, tenFrame, pandas and numpy libraries, and create a 1010data session:
import py1010
import tenFrame as tf
import pandas as pd
import numpy as np
session = py1010.Session("1010data URL", "USERNAME", "PASSWORD", py1010.POSSESS)
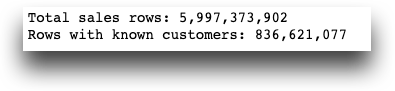
Example 1: Sales data rows#
This example shows the total number of sales rows and the number of rows with known customers (stripping the NA values).
sales = tf.TenFrame(session, "retaildemo.retail.sales_detail")
# without downsampling, describe() below takes about 6 minutes.  Plan accordingly.
# sales = sales.sample(frac=1e-3)
print(f"Total sales rows: {len(sales):,}")
# Sales linked with customer data, filtered to rows where such data exists.
salescust = tf.merge(sales, "retaildemo.retail.customers", on="customer_key")
salescust.dropna(subset=["customer_key"], inplace=True)
print(f"Rows with known customers: {len(salescust):,}")
# Sales linked with product data
salesprod = tf.merge(sales, "retaildemo.retail.products", on="sku")
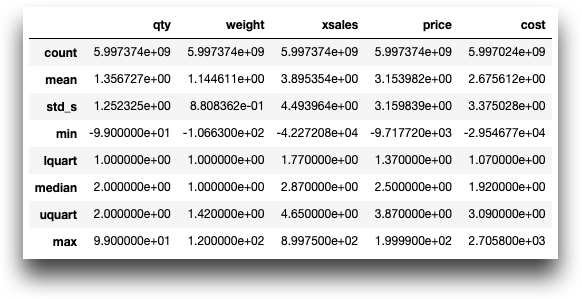
Example 2: Sales data overview#
We can use tenFrame.TenFrame.describe() to show an overview of the sales data.
%%time
sales.describe(exclude=["transid", "date", "tme", "sku", "store", "customer_key", "promo_flag"])
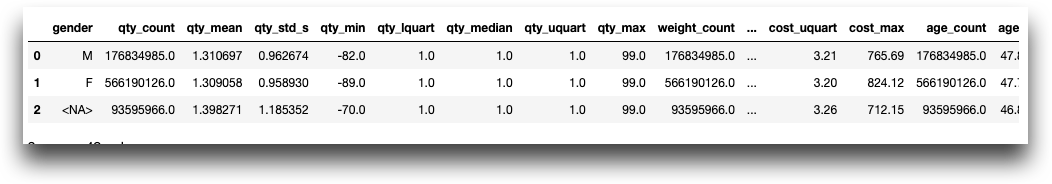
Example 3: Sales data detail#
The following shows an overview at a slightly more granular level, with customer data.
%%time
salescust.groupby("gender").describe(exclude=["transid", "date", "tme", "sku", "store", "customer_key", "promo_flag", "birthdate", "customerid", "tier"])
# (the short and very very wide format is what pandas does as well)
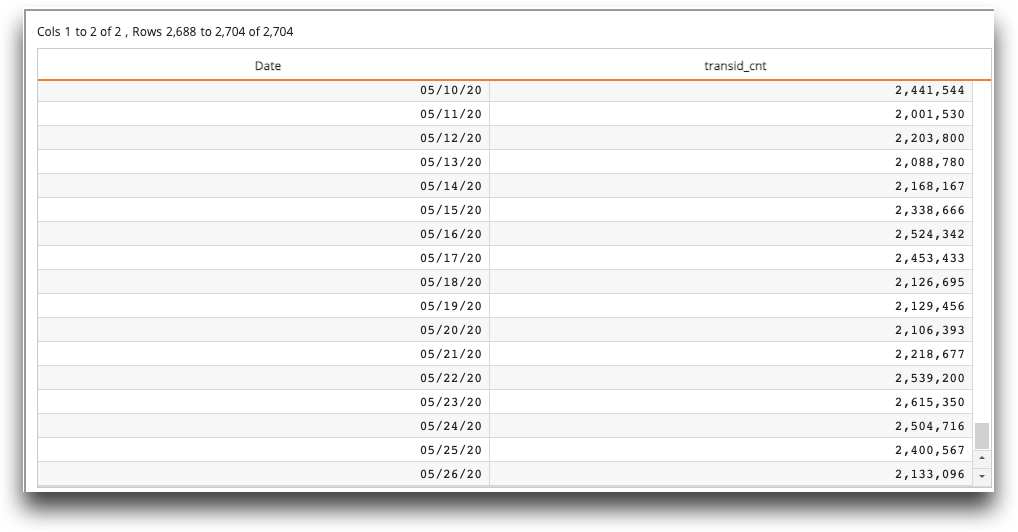
Example 4: Count of transactions by date#
This example shows the total number of transactions for each date.
%%time
r = sales.groupby("date").transid.cnt()
q = r.iloc[0]       # Something to make the time shown honest.
r
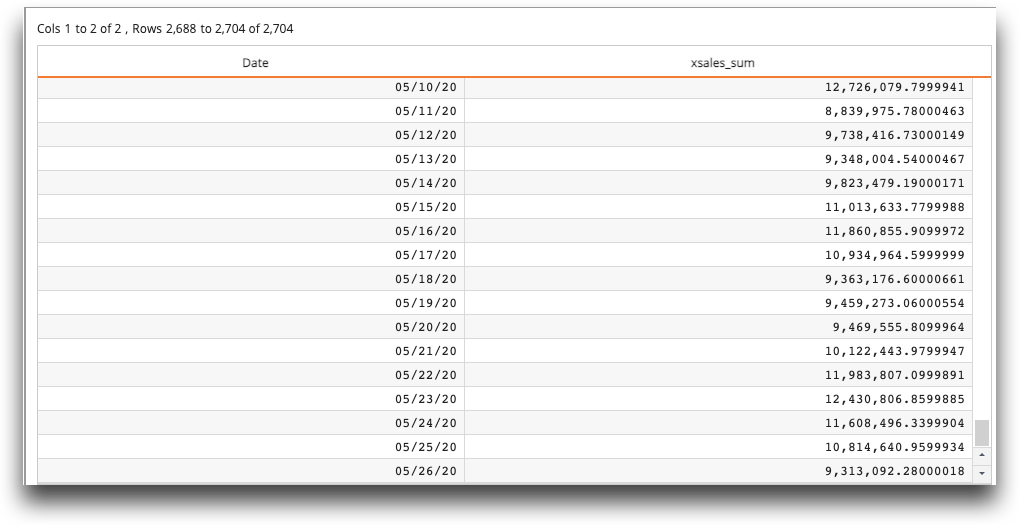
Example 5: Total sales by date#
This example shows the total dollar amount of sales for each date.
%%time
r = sales.groupby("date")['xsales'].sum()
q = r.iloc[0]
r
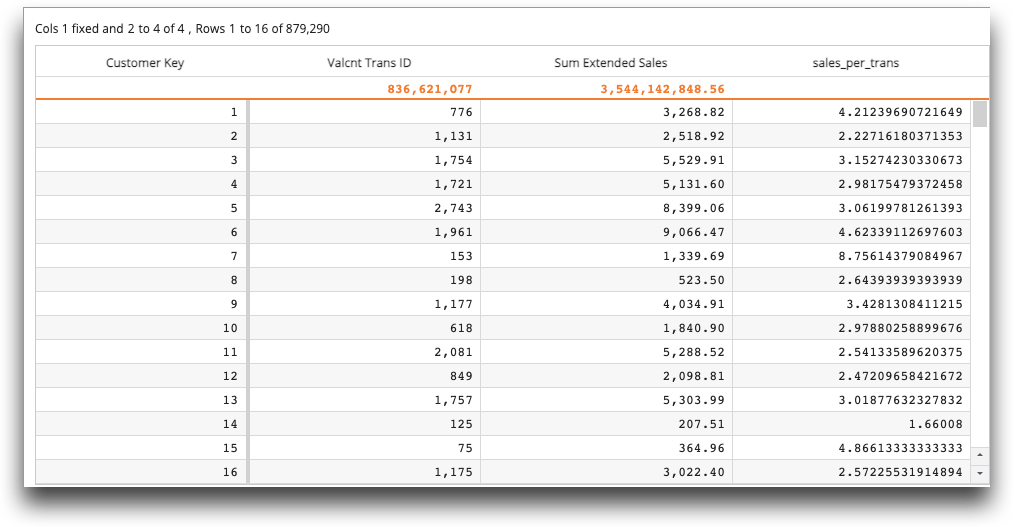
Example 6: Transactions, total sales, and sales per transaction, by customer#
This example breaks down the number of transactions, total sales, and the average sales per transaction, by customer number.
%%time
r = salescust.groupby("customer_key").agg({"transid":"count", "xsales":"sum"})
r['sales_per_trans'] = r['xsales_sum'] / r['transid_count']
q = r.iloc[0]
r
Charting examples#
The following code snippets demonstrates the types of charts available in TenFrame. See tenFrame.TenFrame.Plotter for a complete description of the plot types in TenFrame.
Chart 1: Bar chart on total sales by gender#
salescust.groupby("gender")['xsales'].sum().plot(kind="bar", x="gender", y="xsales_sum")
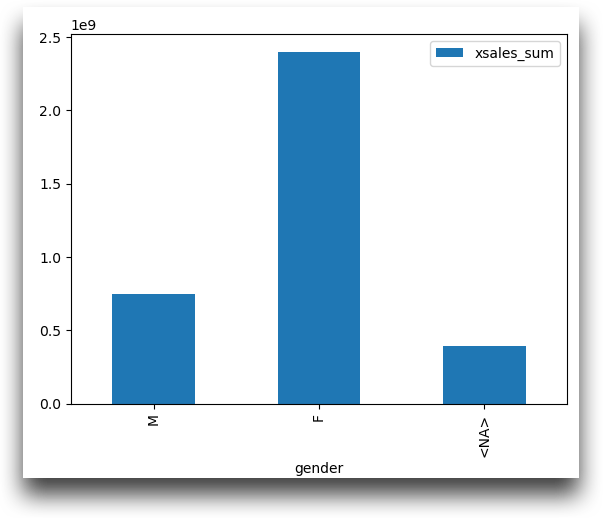
Chart 2: Histogram on total sales by age#
salescust[['age']].plot(kind="hist")
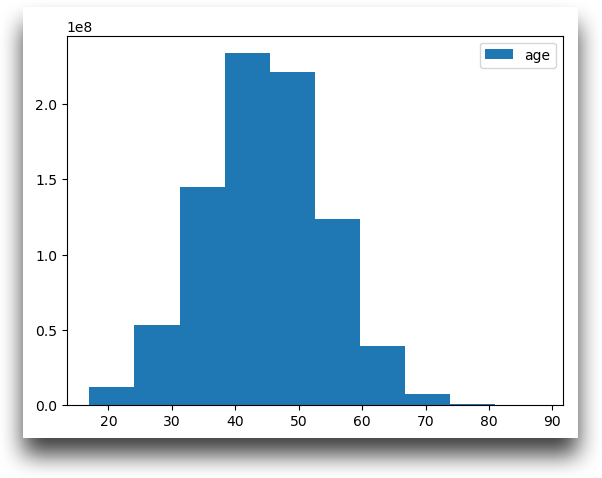
Chart 3: Bar chart on number of transactions by age group#
salescust.groupby("age_group").transid.cnt().sort_values("age_group").plot(kind="bar", x="age_group", y="transid_cnt")
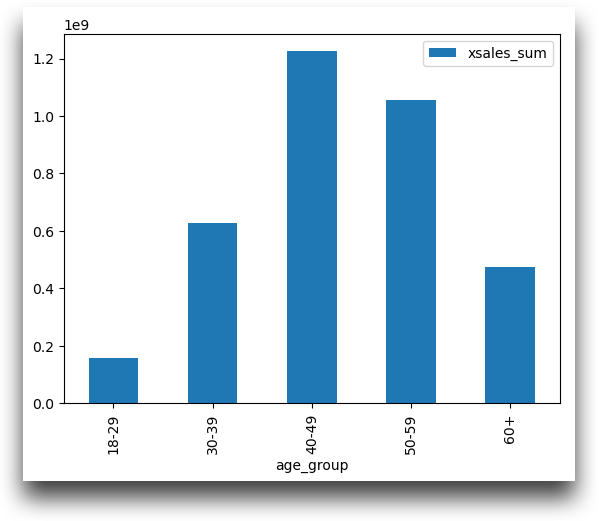
Chart 4: Bar chart on total sales by age group#
salescust.groupby("age_group").xsales.sum().sort_values("age_group").plot(kind="bar", x="age_group", y="xsales_sum")
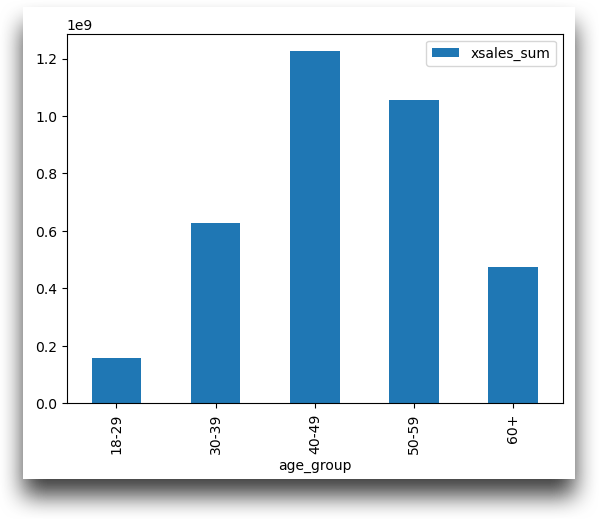
Chart 5: Line graph of total sales by date#
sales.groupby("date").xsales.sum().plot(kind="line", x="date", y="xsales_sum")
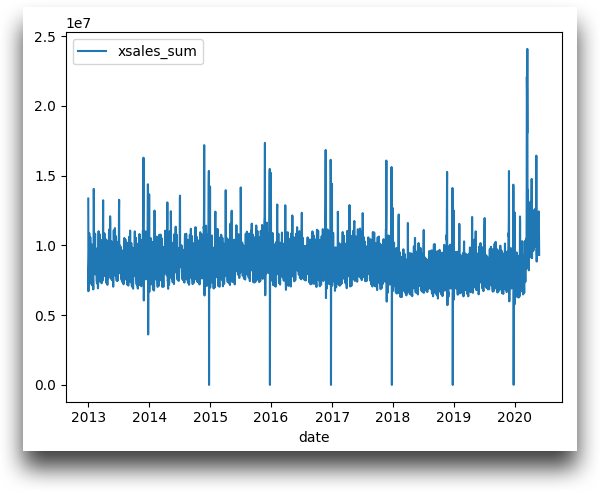
Chart 6: Histogram of total sales by date#
sales.groupby("date").xsales.sum()[['xsales_sum']].plot(kind="hist")
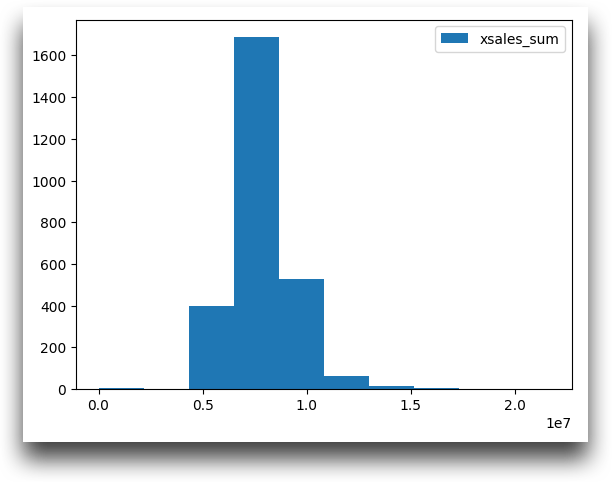
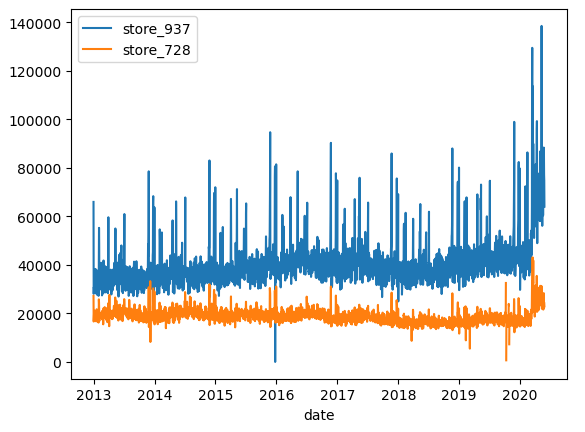
Chart 7: Comparison of total sales of two stores#
rr = sales[sales.store == 937].groupby("date").xsales.sum(name="store_937")
rr2 = rr.merge(sales[sales.store == 728].groupby("date").xsales.sum(name="store_728"), on="date")
rr2.plot(kind="line", x="date", y=["store_937", "store_728"])