
Most Profitable Weekday in Month
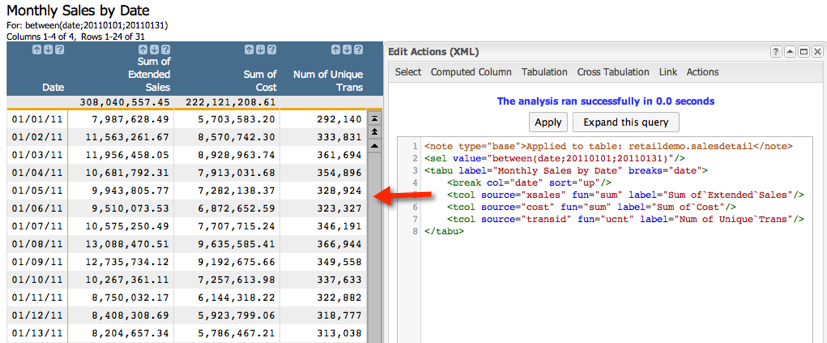
The next step in our basic analysis of sales data is to determine what the most profitable weekday was for a given month (or whatever period of time you prefer to evaluate). We'll start with the tabulation we have already produced, which give us totals for sales and cost for each date in January, 2011, as follows:
- Create a computed column that assigns a week day for each date in the table
- Create a tabulation that groups by week day and summarizes sales and cost for each one
- Create a computed column that calculates margin (aka profit!)
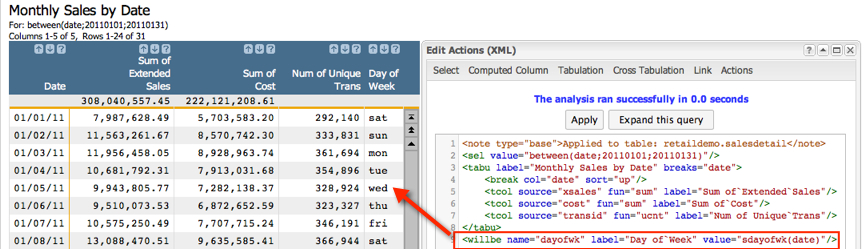
Step 1: Assign a week day to each date. While we could do this by going to , we're actually going to do everything for this part of the analysis in the Macro Language. Start with the code we generated last time and then add the last line in bold:
<sel value="between(date;20110101;20110131)"/>
<tabu label="Monthly Sales by Date" breaks="date">
    <break col="date" sort="up"/>
    <tcol name="sumsales" source="xsales" fun="sum" label="Sum of`Extended`Sales"/>
    <tcol name="sumcost" source="cost" fun="sum" label="Sum of`Cost"/>
    <tcol name="transucnt" source="transid" fun="ucnt" label="Num of`Unique`Values`in`Trans`ID"/>
</tabu>

<note>Create a computed column that assigns a week day to each date using the sdayofwk(X) function</note>
<willbe name="dayofwk" label="Day of`Week" value="sdayofwk(date)"/>
The line above produces the following results:
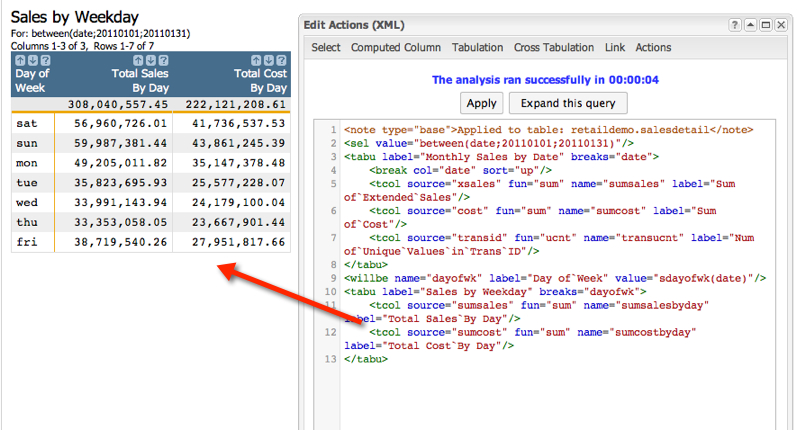
Step 2, perform a tabulation and use the new column we just created as the group by column:
<sel value="between(date;20110101;20110131)"/>
<tabu label="Monthly Sales by Date" breaks="date">
    <break col="date" sort="up"/>
    <tcol name="sumsales" source="xsales" fun="sum" label="Sum of`Extended`Sales"/>
    <tcol name="sumcost" source="cost" fun="sum" label="Sum of`Cost"/>
    <tcol name="transucnt" source="transid" fun="ucnt" label="Num of`Unique`Values`in`Trans`ID"/>
</tabu>

<note>Create a computed column that assigns a week day to each date using the sdayofwk(X) function</note>
<willbe name="dayofwk" label="Day of`Week" value="sdayofwk(date)"/>

<note>Tabulate using sdayofwk as the grouping column. Summarize both sales and cost</note>
<tabu label="Sales by Weekday" breaks="dayofwk">
    <tcol name="sumsalesbyday"source="sumsales" fun="sum" label="Total Sales`By Day"/>
    <tcol name="sumcostbyday" source="sumcost" fun="sum" label="Total Cost`By Day"/>
</tabu>
Notice here that we are tabulating a tabulation. No problem. Tabulations are just regular old 1010data worksheets, and can be manipulated the exact same ways as any other table or worksheet. Here are the results of the last tabulation:
Step 3, calculate margin (profits rule!!). To do this, create another computed column. Again, feel free to do this in the GUI, but we'll stick to the Macro Language for this example:
<sel value="between(date;20110101;20110131)"/>
<tabu label="Monthly Sales by Date" breaks="date">
    <break col="date" sort="up"/>
    <tcol name="sumsales" source="xsales" fun="sum" label="Sum of`Extended`Sales"/>
    <tcol name="sumcost" source="cost" fun="sum" label="Sum of`Cost"/>
    <tcol name="transucnt" source="transid" fun="ucnt" label="Num of`Unique`Values`in`Trans`ID"/>
</tabu>

<note>Create a computed column that assigns a week day to each date using the sdayofwk(X) function</note>
<willbe name="dayofwk" label="Day of`Week" value="sdayofwk(date)"/>

<note>Tabulate using sdayofwk as the grouping column. Summarize both sales and cost</note>
<tabu label="Sales by Weekday" breaks="dayofwk">
    <tcol name="sumsalesbyday"source="sumsales" fun="sum" label="Total Sales`By Day"/>
    <tcol name="sumcostbyday" source="sumcost" fun="sum" label="Total Cost`By Day"/>
</tabu>

<note>Create a computed column to calculate margin by weekday</note>
<willbe name="marginbyweekday" label="Margin by`Weekday" value="sumsalesbyday - sumcostbyday"/>
Run the code and you should get the following results:
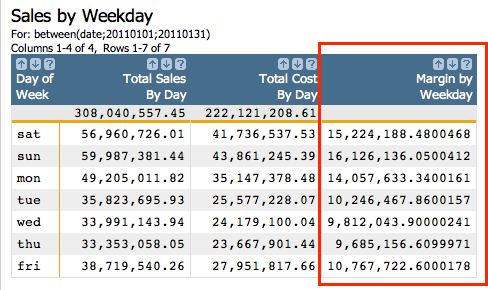
Our results tell us that Saturday and Sunday are by far our most profitable days of the week. This makes a lot of sense, since that's when most people actually have time to go grocery shopping. Still, it's nice to not only know for sure, but be able to attach hard numbers to the phenomenon. But it does raise another question. It is intuitive that our highest margins, in terms of total dollars, are on the same days we have the highest sales, also in terms of total dollars. However, if we want to think about this same relationship in terms of percentages, does the same dynamic hold true?
Just for fun, let's create one last computed column. This time we're going to calculate margin as a percent of cost, to understand if we're profiting by a higher or lower percentage of our cost on a given day of the week. Remember, this will only apply to January 2011, but we could easily use this same process to understand these relationships across any time period we like.
<sel value="between(date;20110101;20110131)"/>
<tabu label="Monthly Sales by Date" breaks="date">
    <break col="date" sort="up"/>
    <tcol source="xsales" fun="sum" name="sumsales" label="Sum of`Extended`Sales"/>
    <tcol source="cost" fun="sum" name="sumcost" label="Sum of`Cost"/>
    <tcol source="transid" fun="ucnt" name="transucnt" label="Num of`Unique`Values`in`Trans`ID"/>
</tabu>
<willbe name="dayofwk" label="Day of`Week" value="sdayofwk(date)"/>
<tabu label="Sales by Weekday" breaks="dayofwk">
    <tcol source="sumsales" fun="sum" name="sumsalesbyday" label="Total Sales`By Day"/>
    <tcol source="sumcost" fun="sum" name="sumcostbyday" label="Total Cost`By Day"/>
</tabu>
<willbe name="marginbyweekday" label="Margin by`Weekday" format="dec:2" value="sumsalesbyday - sumcostbyday"/>

<note>Create a computed column to calculate margin as a percentage of total cost</note>
<willbe name="percentmargin" label="Margin as Percent`of Cost" value="(marginbyweekday/sumcostbyday)*100" format="dec:2"/>
Click the Submit button to run the code. Let's take a close look at the results:
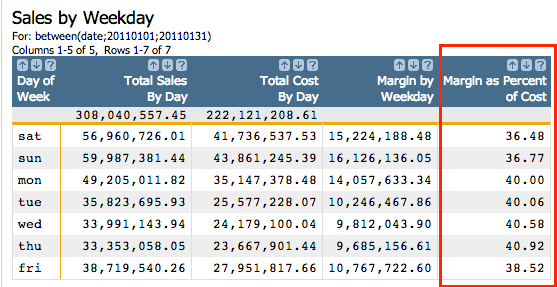
Now this is interesting. While Saturday and Sunday are our two highest margin days in terms of total dollars, they actually represent the two days where our margin represents the least profit as a percentage of total cost. What could account for this apparent inversion of the relationship?
- Are higher margin items sold in a higher percentage of the total volume of items during week days, as opposed to weekends?
- Are lower margin items sold in a higher percentage of the total volume of items during weekend days, as opposed to regular weekdays?
- Do these results reflect a seasonal result or do they hold their integrity throughout the entire year?
You can answer all the questions above with the basics building blocks we've already covered in this tutorial. However, as always, the most interesting questions are the ones you invent yourself.