
Retail Sales Analysis
The 1010data Quick Start Guide breaks down basic operations in 1010data and how each can individually be used to perform a basic analysis. If you've read that guide you should have a basic idea on how to do things like select row, create metrics with computed columns, and summarize data sets with a tabulation or cross-tabulation. This guide will walk you through how to take those atomized operations and combine them to produce meaningful insights and analysis. The first project we'll look at is how to perform a basic market basket analysis.
Market basket analysis is broad term for the kinds of analyses used to better understand sales patterns and shopper behavior. Like any good analysis, this one starts with a simple questions: How much, in terms of dollars, am I selling on each day of a given month? In this instance, we want to look at a month's worth of data, and then summarize the whole month with a day by day breakdown of sales in dollars. The first step is to specify the actual month we are interested in. But first, let's take a quick look at the data we're going to analyze.
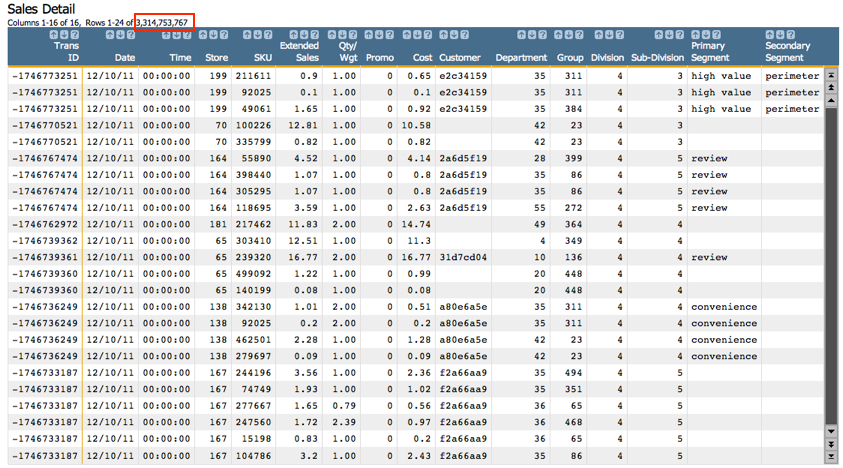
If you read the 1010data Quick Start Guide this might look familiar to you. This data contains all the same columns as the very small (35 rows) data set that was used in that tutorial. However, in this version, you can see that the number of rows is much higher (3.3 billion!). Regardless of the size of the table, both these data sets share basic information. They contain the transaction number, date of the transaction, the SKU (product identification number) for each item purchased, and the date of the transaction, among others. Now that we understand the data a little better, we're going to revisit out central question: How much in sales is my organization doing, day by day, in a month?
Since we are primarily interested in a single month's worth of data, the first step is to narrow down the rows in the table to only those that take place during the month we're interested in. If you'd like to use the GUI for this, feel free. But part of this guide is helping you get comfortable with the 1010data Macro Language. So we'll provide both the GUI and Macro Language way of doing things for the first few tutorials. But don't be shocked if at some point we're only working with the Macro Language. Here's our date selection in the GUI:
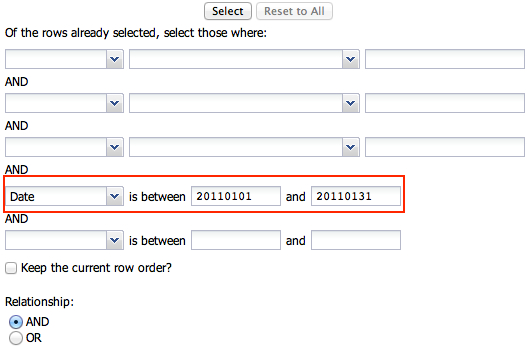
<sel value="between(date;20110101;20110131)"/>
As you may have noticed, we're using the between(X;Y;Z) function to select
our date range. between(X;Y;Z) is great for date selections, and has many
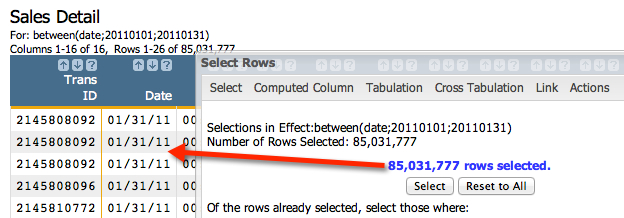
other useful purposes. Once the selection is made, we'll go from our initial 3.3 billion rows
of data to a more manageable 85 million, as shown below:
- Group by the date
- View the sum of sales
- View the total costs for the items sold on each day
- View the number of transactions on each day
Let's take a look at the Tabulation... dialog to understand how to create the aggregations we're interested in. Then, we'll quickly run through the Macro Language code. Here's the dialog:
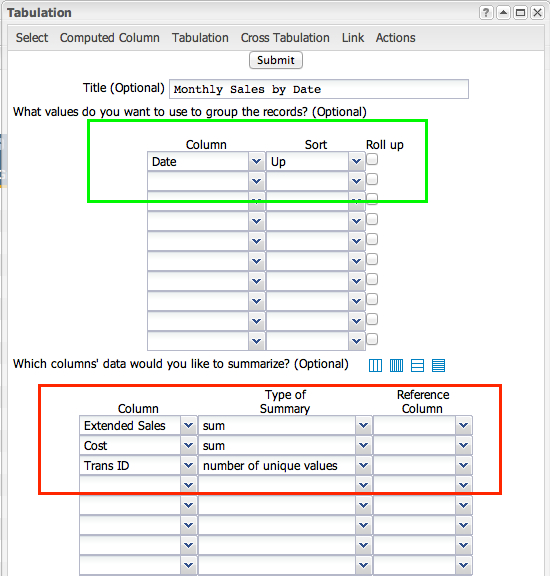
Now that we've defined our grouping metric and the summarizations we're interested in, click Submit to get the results:
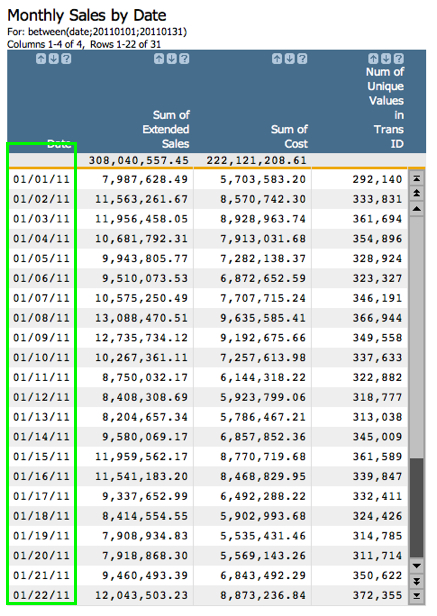
As you can see, we've produced a tidy summarization that clearly lists sales totals for each date within January, 2011. And just in case you're interested, here's a nicely commented Macro Language version of this analysis:
<note>First step is to select the month (or other time period) of interest</note>
<sel value="between(date;20110101;20110131)"/>

<note>Next, create a tabulation with the tabu element. The breaks attribute specifies the column to group by.</note>
<tabu label="Monthly Sales by Date" breaks="date">

    <note>The break element tells the system how to sort the values in the group-by column</note>
    <break col="date" sort="up"/>

    <note>This tcol element is the first summarization in the tabulation. It produces the sum of extended sales</note>
    <tcol name="sumsales" source="xsales" fun="sum" label="Sum of`Extended`Sales"/>


    <note>This tcol creates a sum of the total cost for each date</note>
    <tcol name="sumcost" source="cost" fun="sum" label="Sum of`Cost"/>

    <note>This tcol counts the number of unique transaction IDs for each date</note>
    <tcol name="transucnt" source="transid" fun="ucnt" label="Num of`Unique`Values`in`Trans`ID"/>
</tabu>
And just in case you don't care about the comments, here's the code the system produces (or which a savvy 1010data user might write):
<sel value="between(date;20110101;20110131)"/>
<tabu label="Monthly Sales by Date" breaks="date">
    <break col="date" sort="up"/>
    <tcol name="sumsales" source="xsales" fun="sum" label="Sum of`Extended`Sales"/>
    <tcol name="sumcost" source="cost" fun="sum" label="Sum of`Cost"/>
    <tcol name="transucnt" source="transid" fun="ucnt" label="Num of`Unique`Values`in`Trans`ID"/>
</tabu>
Producing a basic summary of sales by date for a given time period is a very common way of measuring retail sales performance. In 1010data it can be performed on truly massive data sets in a matter for a couple minutes. Try your hand and playing with these values and altering the analysis to answer your own questions. For instance, as a follow up, try to determine the margin for each day of the month.
Next up, we'll take this analysis one step further by determining what the most profitable weekday of the month is.