
Sample QuickApp
This basic QuickApp provides an example of Macro Language code that sends and receives messages to and from an enclosing JavaScript application.
When communicating with an external JavaScript application, understanding how the
transmitter and receiver widgets facilitate that
communication is important.
In this example, the QuickApp uses the receiver widget to receive a message
sent from a web application via the JavaScript postMessage method. The
message specifies values that should be assigned to particular dynamic variables. See receiver in the 1010data Reference
Manual for more information on this widget.
The transmitter widget lets the QuickApp send a message (via a JavaScript
postMessage call) that will be received by the encapsulating JavaScript
application. The transmitter widget sends a message whenever a change is made
to any of the dynamic variables it references. The JavaScript application will then update its
variables based on the values it receives from the transmitter widget. See
transmitter in the 1010data
Reference Manual for more information on this widget.
- Provides a drop-down menu to select a year to filter the results for the data to be plotted
- Plots a line chart consisting of the mean temperature for the 15th of every month over the period of a given year for a particular zip code
- Displays the plotted data in tabular form
- Shows a progress bar while the QuickApp is running any queries
The complete QuickApp code is shown below:
<defblock name="sel_year">
    <table>2014;2015
    </table>
</defblock>
<defblock name="to_plot" zipcode="10017" year="2015">
  <base table="pub.demo.weather.wunderground.observed_daily"/>
  <sel value="year(date)={@year}"/>
  <sel value="zipcode={@zipcode}"/>
  <sel value="day(date)=15"/>
  <colord cols="zipcode,date,meantempi"/>
  <sort col="date" dir="up"/>
</defblock>
<dynamic year="2015" zipcode="10017">
  <widget class_="receiver"/>
  <widget class_="transmitter" message_="{@year},{@zipcode}" onrender_="1"/>
  <widget class_="progressbar" display_="top"/>
  <layout arrange_="v">
    <widget class_="dropdown" label_="Select a year"
     value_="@year" insert_="sel_year"/>
    <widget class_="graphics" width_="700"
     base_="pub.demo.weather.wunderground.observed_daily">
        <call block="to_plot" year="{@year}" zipcode="{@zipcode}"/>
        <graphspec width="600" height="400">
            <chart type="line" samples="100000">
                <style seriescolors="#F26F21" linemarkershow="0"/>
                <data x="date" y="meantempi" yrot="65"/>
            </chart>
        </graphspec>
    </widget>
    <widget class_="grid" type_="scroll"
     base_="pub.demo.weather.wunderground.observed_daily">
        <call block="to_plot" year="{@year}" zipcode="{@zipcode}"/>
    </widget>
  </layout>
</dynamic>
Notice that the QuickApp filters by zip code, but doesn't provide any UI for the user to make a selection on that metric. The input mechanism will be provided by the web application.
The following is an annotated screenshot of the QuickApp:
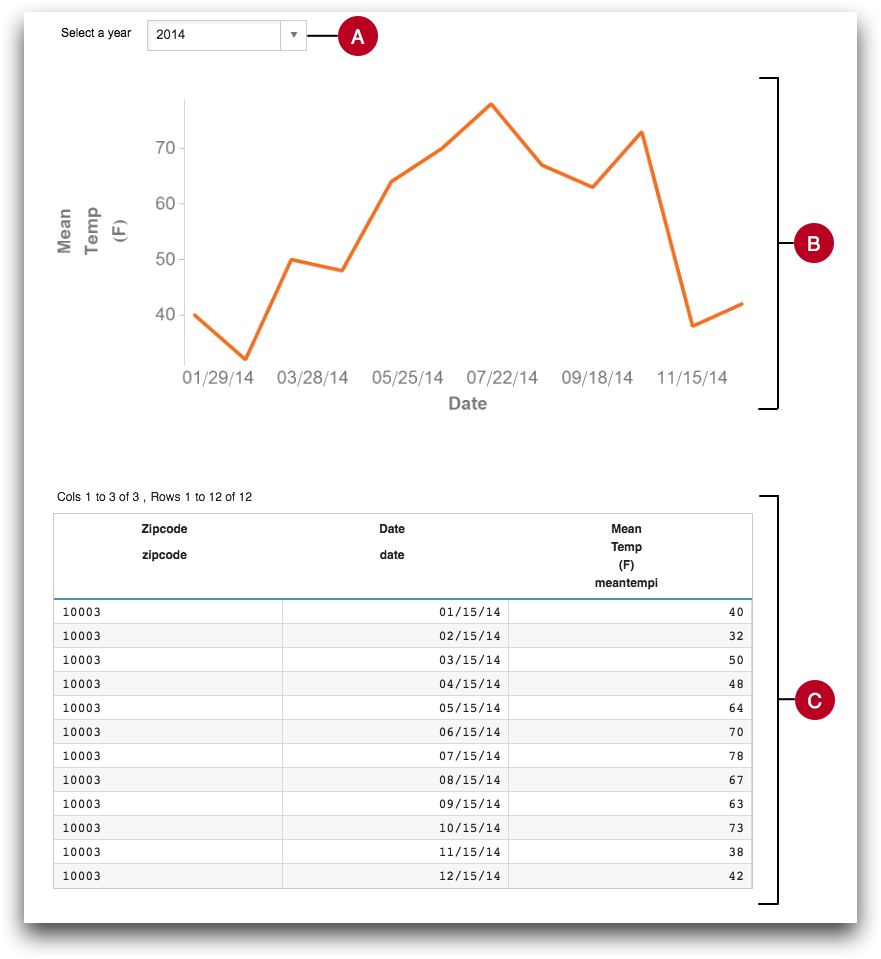
- A. Select a year
- A drop-down menu that provides the end user with two options:
2014 or 2015. The values are provided by
the
<defblock>namedsel_year. - B. Mean temperature over time chart
- A line chart displaying the mean temperature (in Fahrenheit) for the 15th of each
month of the selected year for a particular zip code. The data that will be plotted is
specified via the
<defblock>namedto_plot. - C. Mean temperature over time grid
- A grid widget that displays the data that is being graphed in the line chart. Data for
this grid is also specified by the
<defblock>namedto_plot.
<dynamic> element, which for
this example contains the following widgets: receiver- receives messages from the JavaScript applicationtransmitter- sends messages to the JavaScript applicationprogressbar- shows a progress bar while the QuickApp is running any queriesdropdown- allows the user to select a year to filter resultsgraphics- displays the resultant data in the form of a line chartgrid- displays the resultant data in tabular form
<layout> element is used to vertically arrange the three visible
widgets.transmitter nor the receiver
widget has any visible manifestation when the QuickApp is run.The receiver widget is created with the following Macro Language code:
<widget class_="receiver"/>
When it receives a message sent from a web application via the JavaScript
postMessage method, it sets the dynamic variables specified in the message
to the supplied values.
The transmitter widget is created with the following Macro Language
code:
<widget class_="transmitter" message_="{@year},{@zipcode}" onrender_="1"/>
The message_ attribute specifies the format of the message the
transmitter widget will send to the JavaScript application. In this
example, the message will consist of the values of the dynamic variables year
and zipcode, separated by a comma. When either of these dynamic variables
change, a message is sent to the JavaScript application. When it sends this message to the DOM
of the enclosing web application, the application will store the value of the message as a
comma-separated list and process it accordingly. Because onrender_="1", a
message will be sent to the containing web application when the QuickApp is initially
rendered.
In addition, it is highly advisable to include a progressbar widget in your
QuickApp if it is going to be embedded within an external web application. This gives the user
a visual indicator that the QuickApp has received the inputs and is running the applicable
queries. The progressbar widget in this example is created with the following
line of code:
<widget class_="progressbar" display_="top"/>
Since display_="top", the progress bar will appear over the top of the
QuickApp. See progressbar in the 1010data
Reference Manual for more information.
See Sample web application for an example of JavaScript code that can be used to connect this QuickApp with an external web application.