Data Aggregation
If you are new to the world of Big Data, you may still be familiar with the concept of data aggregation, but you might not be aware of your own familiarity. In essence, aggregation is what we call the process of starting with many data points and arriving at a smaller number of more meaningful data points.
A basic example many people are familiar with is the MS Excel concept of a "pivot table." MS Excel limits the total number of rows to 1 million in a worksheet, so if you ask us, it isn't exactly what we consider Big Data.
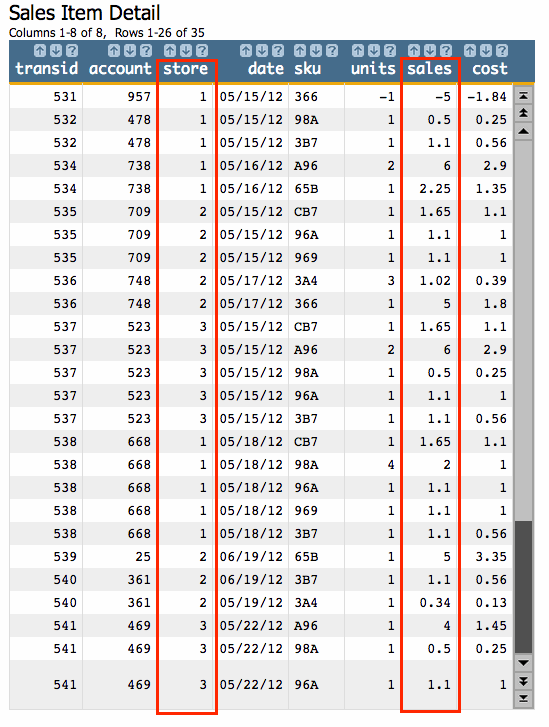
In 1010data, we have a very similar concept called a tabulation. Tabulations are a very common way to summarize your data to understand something specific about it. To start, let's look at the most basic example we could think of. We're going to start with a small data table of retail sales transactions. This is what it looks like:

Above we have 35 rows of data, organized as follows: 1 line for each item in a single transaction. So, for instance, in transaction 532, two items were purchased, so we have two rows of data. Other data points include the store number, the date and the customer account under which each purchase was made.
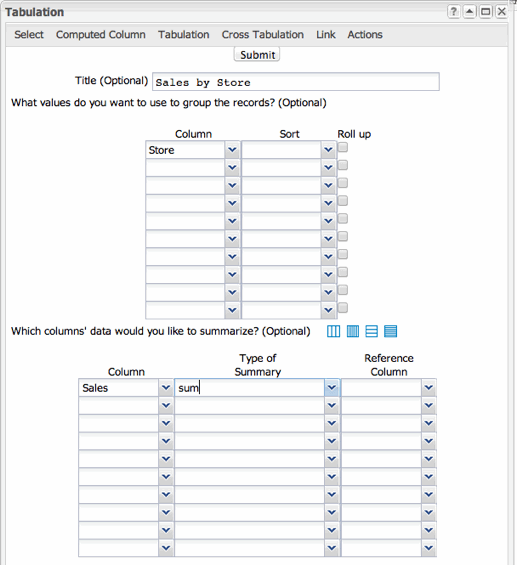
We would like to find out the total number of sales for each store (as indicated by the columns outlined in red). This is fairly easy to do with a tabulation. Using 1010data's web-based interface we can easily summarize our data as sales by store. In other words, if we group the sales data so that only data for a given store is collected within the group, then we can do whatever we want to that data and it will tell us something meaningful about the store itself. In this case, we merely want to add up all the sales data we've grouped by store. We'll simply go to and set up our tabulation in the Tabulation dialog. The setup looks like this:

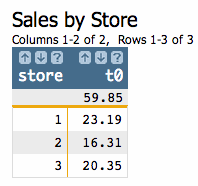
And the result of our tabulation looks like this:

If this looks familiar to you, you're on the right track. We performed this exact same tabulation in our award winning tutorial: "Summarizing Data in 1010data: Tabulation." Follow the link to review that content.
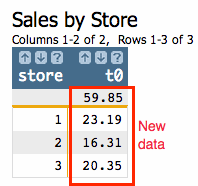
The analysis we just performed on our base table should be fairly apparent whether you're familiar with our earlier tutorial or not. We simply added up the sales figures for each store and then placed those totals in a column. We can now easily see how much in total sales each store had in our data set. Another important thing to note about this operation is that we wind up with some of the original data and some new data. The store numbers existed in our original table. The sales totals did not. So by producing the sales totals we have added new value to the original information of the store numbers.

Summarizing your data in this way is very useful and if you're coming from the Excel world it can be comforting. However, in 1010data, tabulations are only one way to arrive at useful data summaries. Tabulation, and its exotic cousin the cross-tabulation, provide certain options and advantages. However, due to its design, that being a columnar database, we can leverage the 1010data's system architecture to summarize our data while preserving a lot of the information that tabulations eschew. The tools we use for this are called G_Functions.
Before we move forward, you should be familiar with using functions in 1010data. Typically, our users will use functions in Macro Language queries or in Value Expressions. This article will use examples in Value Expressions.
