
Quarter with Highest Sales and Highest Growth
The next step in our YOY analysis of sales data is to determine which quarter had the highest sales and greatest percent growth. We'll start with the tabulation we have already produced, which gives sales totals for each month/year combination:
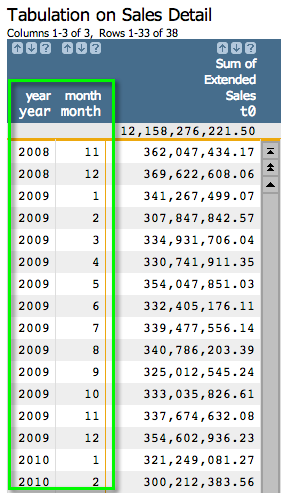
As a reminder, we can obtain the above tabulation using the Macro Language below:
<note type="base">Applied to table: retaildemo.salesdetail</note>
<willbe name="month" value="month(date)"/>
<willbe name="year" value="year(date)" format="type:nocommas"/>
<tabu label="Tabulation on Sales Detail" breaks="year,month">
  <break col="year" sort="up"/>
  <break col="month" sort="up"/>
  <tcol name="tot_sales" source="xsales" fun="sum" label="Sum of`Extended`Sales"/>
</tabu>
- Create a computed column that assigns a quarter to each month in the table
- Create a tabulation that groups by quarter and totals sales
- Create a computed column that calculates percent growth
- Create computed columns that find the highest sales total and the greatest percent growth
Step 1: Assign a quarter to each month. While we could do this by going to , we're actually going to do everything in the Macro Language. Start with the code we generated last time and then add the last line in bold:
<note type="base">Applied to table: retaildemo.salesdetail</note>
<willbe name="month" value="month(date)"/>
<willbe name="year" value="year(date)" format="type:nocommas"/>
<tabu label="Tabulation on Sales Detail" breaks="year,month">
  <break col="year" sort="up"/>
  <break col="month" sort="up"/>
  <tcol name="tot_sales" source="xsales" fun="sum" label="Sum of`Extended`Sales"/>
</tabu>
<willbe name="qtr" value="quarter((year*100)+month)" label="Quarter"/>
The line above produces the following results:
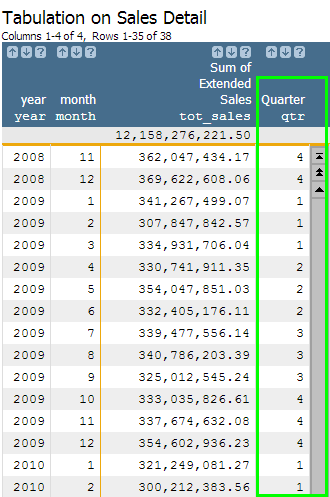
The quarter(X) function outputs the
quarter number associated with each calendar date (e.g., 1, 2, 3, 4). In order to utilize this
function, we had to manipulate and combine our two date columns, year and
month, into an acceptable format that can be recognized by the
quarter(X) function. One of these formats is YYYYMM,
which is why we included the logic quarter((year*100)+month). Since our two
date columns are both in integer format, we can perform mathematical functions on their
values. To get a final number in the YYYYMM format, we just had to multiply
the year by 100 and then add the month value. For example,
if we were looking at the first row, our formula would translate to (2008*100) + 11, which
would result in 200811, our YYYYMM format!
Step 2: Perform a tabulation and group by the newly created Quarter column by entering the text that appears in bold below:
<note type="base">Applied to table: retaildemo.salesdetail</note>
<willbe name="month" value="month(date)"/>
<willbe name="year" value="year(date)" format="type:nocommas"/>
<tabu label="Tabulation on Sales Detail" breaks="year,month">
  <break col="year" sort="up"/>
  <break col="month" sort="up"/>
  <tcol name="tot_sales" source="xsales" fun="sum" label="Sum of`Extended`Sales"/>
</tabu>
<willbe name="qtr" value="quarter((year*100)+month)" label="Quarter"/>
<tabu label="Tabulation on Sales Detail" breaks="year,qtr">
  <break col="year" sort="up"/>
  <break col="qtr" sort="up"/>
  <tcol source="tot_sales" fun="sum" name="qtr_sales"
        label="Total`Qtr Sales"/>
</tabu>
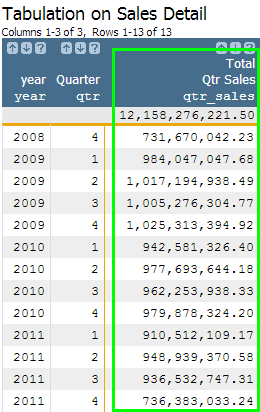
Now we have a very similar summarization of total sales, but by quarter instead of by month.
Note that there are two break columns: qtr and year. If we
only grouped by quarter, for example, it would aggregate sales across all second quarters
across all years. By including the year column in the breaks, we are
distinguishing between the second quarter in different years.
Step 3: Create a computed column to calculate percent growth.
Similar to our original analysis, we can use the g_rshift(G;S;O;X;N) function to
calculate the percent growth by quarter. As an additional challenge, let's see if we can do
this calculation in a single computed column. Remember, originally we first created a column
to copy the prior year's sales value into the current year's row, and then we created another
column to actually do the percentage calculation. This time, we are going to combine these two
steps into one. Essentially, we are going to substitute in the value portion
of our ly_sales computed column into the value portion of
our yoy_perc computed column.
<note type="base">Applied to table: retaildemo.salesdetail</note>
<willbe name="month" value="month(date)"/>
<willbe name="year" value="year(date)" format="type:nocommas"/>
<tabu label="Tabulation on Sales Detail" breaks="year,month">
  <break col="year" sort="up"/>
  <break col="month" sort="up"/>
  <tcol name="tot_sales" source="xsales" fun="sum" label="Sum of`Extended`Sales"/>
</tabu>
<willbe name="qtr" value="quarter((year*100)+month)" label="Quarter"/>
<tabu label="Tabulation on Sales Detail" breaks="year,qtr">
  <break col="year" sort="up"/>
  <break col="qtr" sort="up"/>
  <tcol source="tot_sales" fun="sum" name="qtr_sales"
        label="Total`Qtr Sales"/>
</tabu>
<willbe name="yoy_perc" value="(qtr_sales-(g_rshift(qtr;;;qtr_sales;-1)))/g_rshift(qtr;;;qtr_sales;-1)" format="type:pct;dec:2"/>
The above code will result in the following:
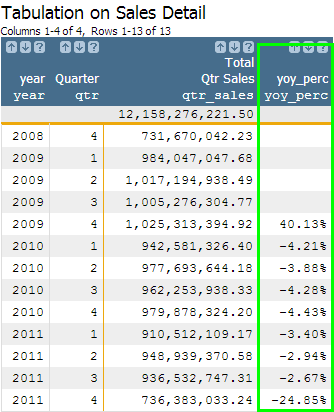
If we wanted to find which quarter had the highest sales or the greatest growth, we could
just sort the columns in descending order, but let's say we want to rank the values without
changing the order of the table. We can do this by creating some new columns using the
g_rank(G;S;O;X) function.
Step 4: For the final step, add the code that appears in bold below to rank the
qtr_sales column and the yoy_perc column separately.
<note type="base">Applied to table: retaildemo.salesdetail</note>
<willbe name="month" value="month(date)"/>
<willbe name="year" value="year(date)" format="type:nocommas"/>
<tabu label="Tabulation on Sales Detail" breaks="year,month">
  <break col="year" sort="up"/>
  <break col="month" sort="up"/>
  <tcol name="tot_sales" source="xsales" fun="sum" label="Sum of`Extended`Sales"/>
</tabu>
<willbe name="qtr" value="quarter((year*100)+month)" label="Quarter"/>
<tabu label="Tabulation on Sales Detail" breaks="year,qtr">
  <break col="year" sort="up"/>
  <break col="qtr" sort="up"/>
  <tcol source="tot_sales" fun="sum" name="qtr_sales"
        label="Total`Qtr Sales"/>
</tabu>
<willbe name="yoy_perc" value="(qtr_sales-(g_rshift(qtr;;;qtr_sales;-1)))/g_rshift(qtr;;;qtr_sales;-1)" format="type:pct;dec:2"/>
<willbe name="rank_sales" value="g_rank(;;;qtr_sales)" label="Sales`Rank"/>
<willbe name="rank_perc" value="g_rank(;;;yoy_perc)" label="Growth`Rank"/>
Now you should see two new columns containing integers ranging between 1 and the number of
total rows in the table, which in this case is 13. The g_rank(G;S;O;X)
function will rank the largest value as 1 and then incrementally number each row in descending
order.
![]()
The data clearly shows that the fourth quarter of 2009 is both the highest selling quarter and the highest growth quarter. You just completed a second analysis by regrouping on a different time frame!
- Do higher priced items account for the higher percentage of total sales during the better performing quarters as opposed to the poorly performing quarters?
- Does volume sold account for the higher percentage of total sales during the better performing quarters as opposed to the poorly performing quarters?
- How has the distribution of item price and volume sold changed over time? Does either move in line with the sales trends?
How to convert integers into month names using
case(X;V1;R1;V2;R2;...;D)
The case(X;V1;R1;V2;R2;...;D) function
allows us to programmatically write, "For column X, if the value is
V1, write R1; if the value is V2, write
R2; if the value is V3, write R3...,
otherwise, write D." Knowing this, you can now see how useful this function
is in our month-naming use case. To convert our original month column of
integers into a new column containing month names, the only logic we need is:
<willbe name="month_name" value="case(month;1;'Jan';2;'Feb';3;'Mar';
                                            4;'Apr';5;'May';6;'Jun';
                                            7;'Jul';8;'Aug';9;'Sep';
                                            10;'Oct';11;'Nov';'Dec')"/>
In the above example, we chose to use the three-lettered month abbreviations, but you can
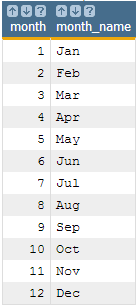
write whatever you prefer. Now, you should have a month_name column that
corresponds to your month column in the following manner:
As you can probably guess, the case(X;V1;R1;V2;R2;...;D) function can be
incredibly useful in various scenarios. Creating your new month_name column
is just the first!