
Retail Year-Over-Year (YOY) Analysis
Retailers frequently measure their performance by comparing current year numbers to prior year numbers. This type of analysis is referred to as a year-over-year (YOY) analysis and can be done many ways using basic 1010data functionality. To start, we will examine how to easily perform a YOY calculation using a simple tabulation, some Group functions (g_functions), and some basic String functions.
One of the most basic ways to measure a retailer's trends, whether by store, department, SKU, or any other dimension, is by finding the difference between the current year's performance and the prior year's performance in terms of dollars or percentages. Let's first answer the question: How much more/less are my sales in a given month as compared to that same month the prior year in terms of dollars? We will use the Sales Detail table as the basis of our analysis. This type of transactional data is quite common among retailers.
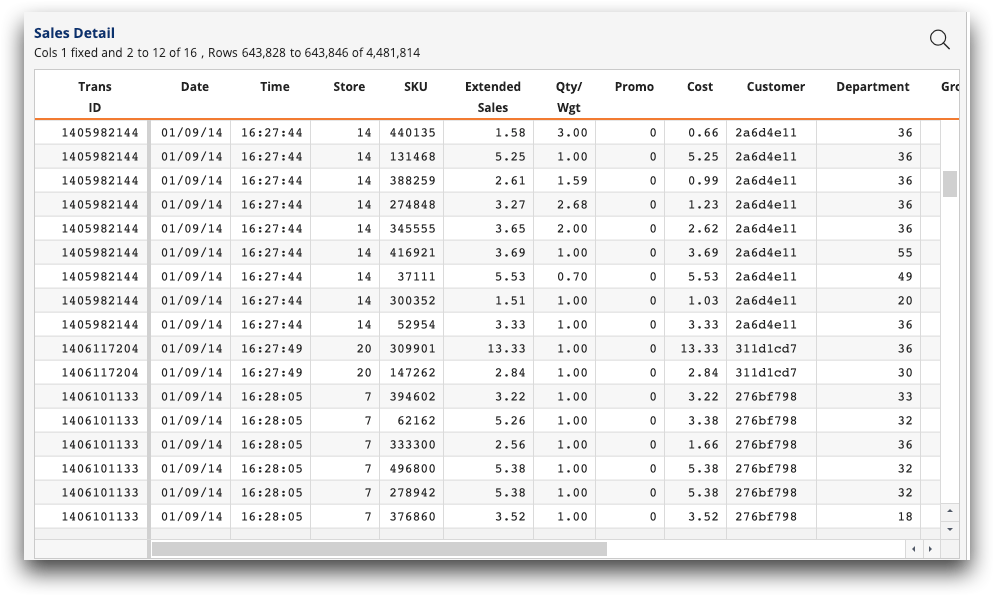
The Sales Detail table contains a transaction number, transaction date, and SKU for every
transaction at our retailer. In addition, the above table includes an Extended
Sales (xsales) column indicating the price of each SKU sold.
This column will be important for our YOY analyses.
Revisiting our central question – How are the sales for each month compared to the sales for the same month the previous year? – we first want to determine what month and year each transaction occurred in. To do this, we can use two simple String functions to extract the month and year from the Date column.
In the menu, select and enter the following:
<base table="pub.doc.retail.salesdetail"/>
<willbe name="month" value="month(trans_date)"/>
<willbe name="year" value="year(trans_date)" format="type:nocommas"/>
Both the month(X) and year(X) functions work to extract the
relevant information from a date column. Both functions produce an integer as the result: The
month(X) function produces a one- or two-digit integer representing the
month of the date, and the year(X) function produces a four-digit integer.
(If you prefer using the month name, whether JAN, Jan, January, etc., you can use the case(X;V1;R1;V2;R2;...;D) function,
which we will touch on at the end of this analysis.) Multiple date formats can be input into
these functions, including the standard MM/DD/YY format in the table above.
format="type:nocommas" isn't necessary for the
calculations to work correctly, but it will simply make the year look correct in the
resulting column.Now that we have all the time information we need, we can begin to aggregate the sales data for each month/year grouping. The simplest way to aggregate the data is by using a tabulation. Because we are concerned with sales by month/year, we will group by both of these new columns and sum up sales.
- Group by the month and year
- Calculate the sum of sales
You can use TRS to perform this tabulation. Just go to
Let's take a look at the Tabulation dialog to understand how to create the aggregations we're interested in. After, we'll quickly run through the Macro Language code generated by this tabulation. Here's the dialog:
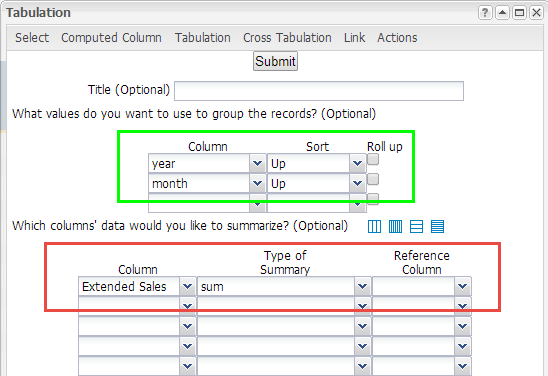
Now that we've defined our grouping metric and the summarizations we're interested in, click Submit to get the results:
<note type="base">Applied to table: retaildemo.salesdetail</note>
<willbe name="month" value="month(date)"/>
<willbe name="year" value="year(date)" format="type:nocommas"/>
<tabu label="Tabulation on Sales Detail" breaks="year,month">
  <break col="year" sort="up"/>
  <break col="month" sort="up"/>
  <tcol source="xsales" fun="sum" label="Sum of`Extended`Sales"/>
</tabu>
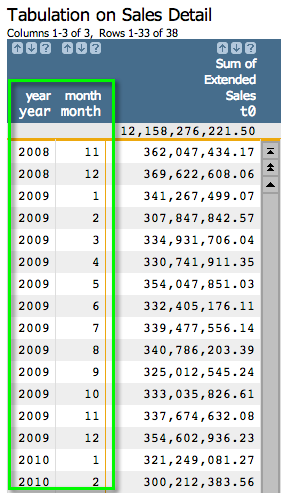
t0 (which you can see at the top of the Sum
of Extended Sales column in the screenshot above). Let's give it a more
meaningful name. In the Edit Actions (XML) dialog, add the following text
that appears in
bold:<note type="base">Applied to table: retaildemo.salesdetail</note> <willbe name="month" value="month(date)"/> <willbe name="year" value="year(date)" format="type:nocommas"/> <tabu label="Tabulation on Sales Detail" breaks="year,month"> <break col="year" sort="up"/> <break col="month" sort="up"/> <tcol name="tot_sales" source="xsales" fun="sum" label="Sum of`Extended`Sales"/> </tabu>
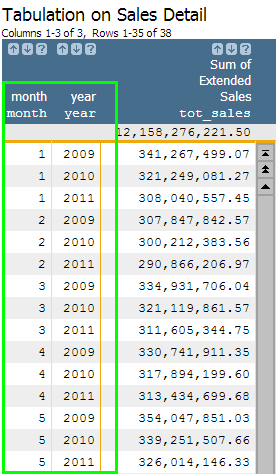
Note that we grouped by year and then month, and not the other way around. While you can just as easily input the break columns in the reverse order, 1010data will sort the columns last to first. In other words, our tabulation sorted the month column in ascending order, and then sorted the year column in ascending order. This is how we can get the appearance we want. If we input the reverse order for the break columns, the resulting tabulation would be ordered the following way:
Now that we understand how we got our tabulation results and what they mean, we need to
compare each month's aggregated sales number to the same number for one year prior. Let's
create a new column that will pull the total sales from one year prior using the G_Function
g_rshift(G;S;O;X;N). In the Edit
Actions (XML) dialog, insert the Macro Language code in bold below to create this
column.
<note type="base">Applied to table: retaildemo.salesdetail</note> <willbe name="month" value="month(date)"/> <willbe name="year" value="year(date)" format="type:nocommas"/> <tabu label="Tabulation on Sales Detail" breaks="year,month"> <break col="year" sort="up"/> <break col="month" sort="up"/> <tcol name="tot_sales" source="xsales" fun="sum" label="Sum of`Extended`Sales"/> </tabu> <willbe name="ly_sales" value="g_rshift(month;;;tot_sales;-1)" format="dec:2" label="Last Year`Sales"/>
Running the above Macro Language code should give you the following results:
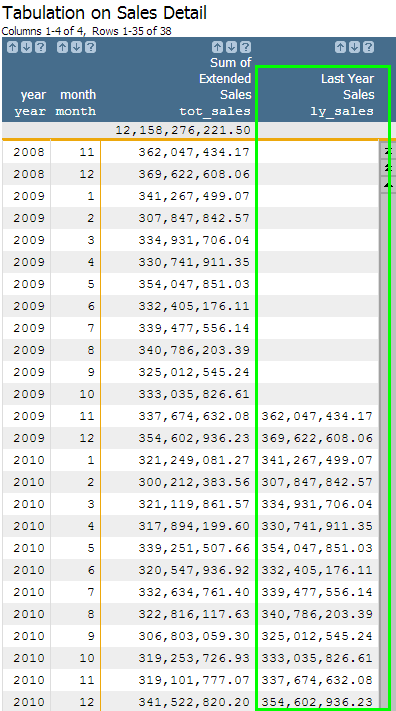
Now let's quickly take a look at the g_rshift(month;;;t0;-1) function and
what it calculated. The G argument is simply the month
column, since that is the time period we are interested in using in our YOY calculations.
Since we want to include all rows in the calculation and do not need to order the data (since
it's already sorted correctly), we can leave the S and O
arguments blank. The X argument contains the column we wish to use the
function on, which would be our new Sum of Extended Sales
(tot_sales) column. Lastly, the N argument is
-1 because we are interested in finding the prior row with the same month
value. Because each month only has one row per year and every year has a row for all 12
months, the prior row for each month would be for the previous year. Not surprisingly, if
there is no data for the prior year's value, the result in the column will be N/A. As we've
already seen, we now have a column (Last Year Sales) that pulls the
value in the tot_sales column for the prior year and copies that value into
our new column (ly_sales) .
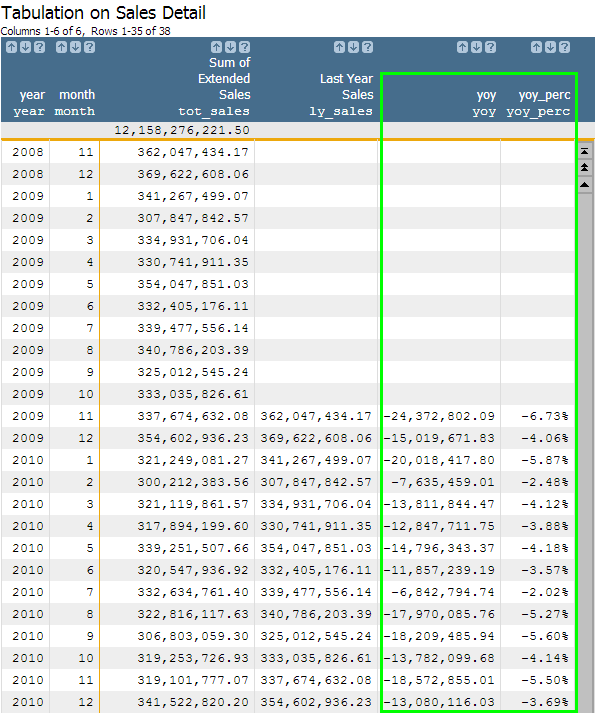
The last step in our analysis is calculating the actual change in sales. Every row now contains both values necessary for the calculation: current sales and prior sales. All we have to do is find the difference. The difference can be represented in several ways, but a simple subtraction or percent calculation is most common. Adding the additional code below will satisfy both methods.
<note type="base">Applied to table: retaildemo.salesdetail</note>
<willbe name="month" value="month(date)"/>
<willbe name="year" value="year(date)" format="type:nocommas"/>
<tabu label="Tabulation on Sales Detail" breaks="year,month">
  <break col="year" sort="up"/>
  <break col="month" sort="up"/>
  <tcol name="tot_sales" source="xsales" fun="sum" label="Sum of`Extended`Sales"/>
</tabu>
<willbe name="ly_sales" value="g_rshift(month;;;tot_sales;-1) format="dec:2" label="Last Year`Sales"/>
<willbe name="yoy" value="tot_sales-ly_sales" format="dec:2"/>
<willbe name="yoy_perc" value="(tot_sales-ly_sales)/ly_sales" format="type:pct;dec:2"/>
Our new column, yoy, simply subtracts last year's sales total from this
year's sales total to give an absolute difference. The column yoy_perc
converts this same subtraction into a percentage increase/decrease of last year's sales total.
The computed columns will look as they do below:
Congratulations! You have just completed a YOY analysis using a tabulation. While this method
is very useful if you want to do other G_Function manipulations on the aggregated sales data,
you can also chose to do the above analysis using a cross tabulation. By using a cross
tabulation, you can get the sales totals for a given month across all years in the same row.
We just did something similar using g_rshift(G;S;O;X;N) to pull last year's
sales into the same row as current year's sales. The cross tabulation will get you there much
more quickly with only a few minor adjustments to the Macro Language code.
Below is the Macro Language for performing the YOY analysis using a cross tabulation. Only the portions that appear in bold differ from our Macro Language for the previous YOY analysis.
<note type="base">Applied to table: retaildemo.salesdetail</note>
<willbe name="month" value="month(date)"/>
<willbe name="year" value="year(date)" format="type:nocommas"/>
<tabu label="Tabulation on Sales Detail" breaks="month" cbreaks="year" clabels="short">
  <break col="year" sort="up"/>
  <tcol source="xsales" fun="sum" label="Sum of`Extended`Sales"/>
</tabu>
<willbe name="yoy" value="m2-m1" format="dec:2"/>
<willbe name="yoy_perc" value="(m2-m1)/m1" format="type:pct;dec:2"/>
<sort col="month" dir="up"/>
g_rshift(G;S;O;X;N)
function because the cross tabulation nicely creates a separate column for each year.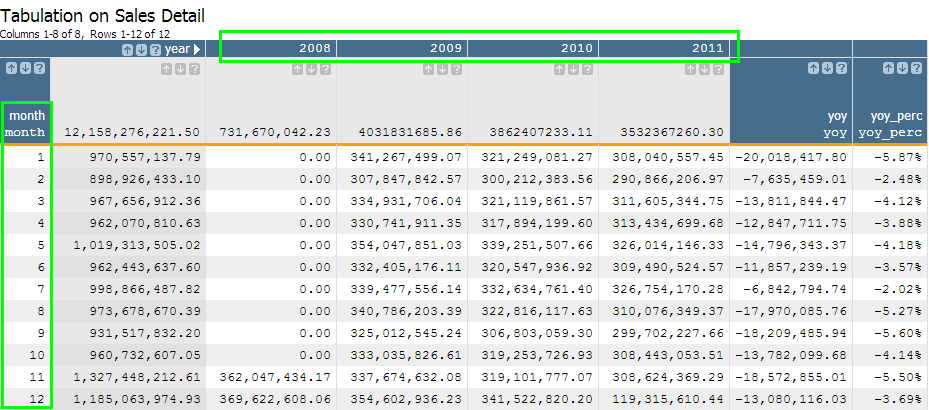
Now that you know how to perform a YOY analysis two ways, let's take this knowledge a step further. Next, we will determine which quarter had the highest sales and which quarter saw the largest YOY growth.