
Python result option
The 1010data Python SDK enables you to convert a small result set into a pandas DataFrame.
The pandas package is used for data analysis. It contains a
DataFrame object which is the pandas primary data
structure. The 1010data Python SDK contains a DataFrame
constructor to convert your result set, or a portion of it, to a DataFrame.
This constructor uses query.dictslice() to create a
dictionary of lists with a starting and ending row value to indicate the
desired slice of data.
dataframe = pandas.DataFrame(query.dictslice(start,end))
It is best to keep this data set small because it will be downloaded and stored in memory. Creating a DataFrame with a large set of data may result in performance issues.
Example
This example converts query results into a pandas
DataFrame, uses the pandas dataframe.pivot to
reshape the data into a pivot table, and create three
graphs.
After retrieving results (q2) from
the 1010data Insights Platform, the results are converted to a
DataFrame (df1) using the
DataFrame constructor.
q2.dictslice(0,100) creates a dictionary of
lists starting at row 0 and ending at
100.
df1 = pd.DataFrame(q2.dictslice(0,100))
dataframe.pivot method reshapes the
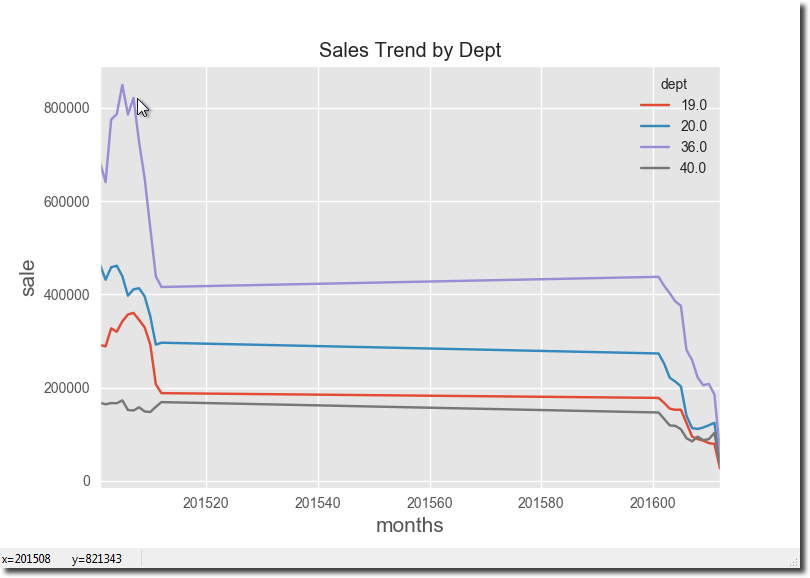
data.df2 = df1.pivot('month','dept','sale')The application uses Matplotlib and Seaborn to create three charts. Close each chart to display the next one. Close the last chart to end the program.
df2.plot()
        plt.ylabel('sale',size=15)
        plt.xlabel('months',size=15)
        plt.title('Sales Trend by Dept')
        plt.show()
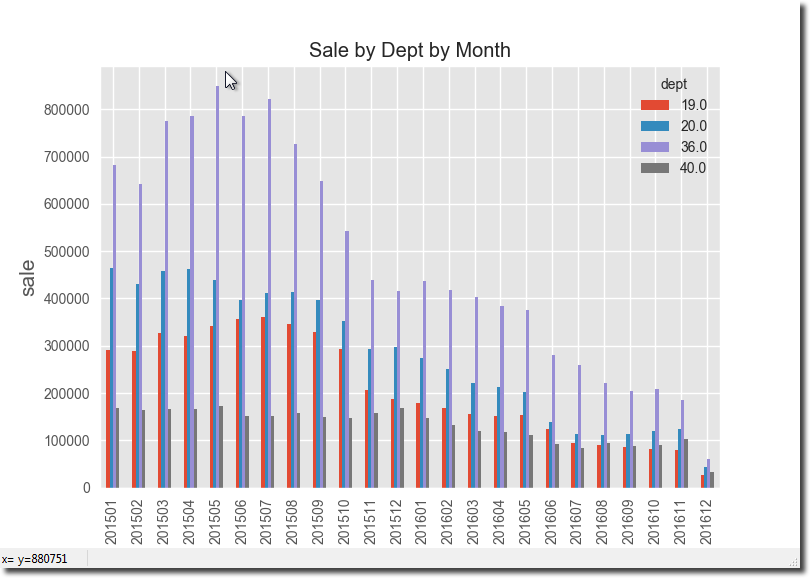
df2.plot.bar()
        plt.xlabel('months',size=15)
        plt.ylabel('sale',size=15)
        plt.title('Sale by Dept by Month')
        plt.show()
plt.figure(3)
        mask=df2.isnull()
        df3 = df1.pivot('dept','month','sale')
        sns.heatmap(df3, cmap="terrain")
        plt.xlabel('months',size=15)
        plt.xticks(rotation=90)
        plt.ylabel('dept',size=15)
        plt.title('Sale by Month by Dept Heatmap')
        plt.show()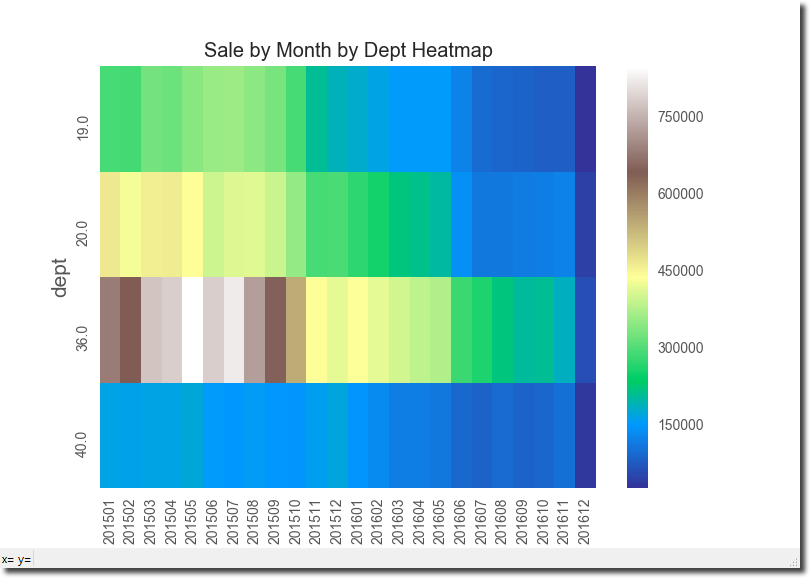
import py1010
import numpy as np
import pandas as pd
import datetime
import matplotlib.pyplot as plt
from matplotlib import style
import seaborn as sns

style.use('ggplot')
username = "[USER_NAME]"
password = "[PASSWORD]"
try:
    with py1010.Session("https://www2.1010data.com/cgi-bin/gw", \
                        username, password, \
                        py1010.POSSESS) as session:
        q2 = session.query("pub.doc.retail.altseg.sales_detail_transid", \
                          ('<sel value="trans_date>20110101"/>' \
                           '<sel value="dept=20 40 36 19"/>' \
                           '<willbe name="month"' \
                           'value="yrmo(trans_date)"' \
                           'format="type:monthshort"/>' \
                           '<tabu breaks="month,dept">' \
                           '<tcol fun="sum" source="xsales"' \
                           'name="sale"/>' \
                           '</tabu>'))
        q2.run()
        df1 = pd.DataFrame(q2.dictslice(0,100))

except py1010.TentenException as exc:
    print("Error: {}".format(exc))

else:
    df1['month']=df1['month'].astype(int)
    df2 = df1.pivot('month','dept','sale')

    df2.plot()
    plt.ylabel('sale',size=15)
    plt.xlabel('months',size=15)
    plt.title('Sales Trend by Dept')
    plt.show()

    df2.plot.bar()
    plt.xlabel('months',size=15)
    plt.ylabel('sale',size=15)
    plt.title('Sale by Dept by Month')
    plt.show()

    mask=df2.isnull()
    plt.figure(3)
    mask=df2.isnull()
    df3 = df1.pivot('dept','month','sale')
    sns.heatmap(df3, cmap="terrain")
    plt.xlabel('months',size=15)
    plt.xticks(rotation=90)
    plt.ylabel('dept',size=15)
    plt.title('Sale by Month by Dept Heatmap')
    plt.show()
[USER_NAME] and
[PASSWORD] are
placeholders for valid Insights Platform user name and
password.