
Formatting data in a grid
You can use a slider widget to select data in a grid where the values are formatted based on the selection.
Difficulty
Objective
You want to create a chart driven by conditionally formatted data selected using a slider. The slider ranges from 0% to 100%, and the user can move both ends to select their desired percentage of data. When data is selected, you want the values to be formatted black in the table, and if the data is not selected you want it to appear red.
Solution
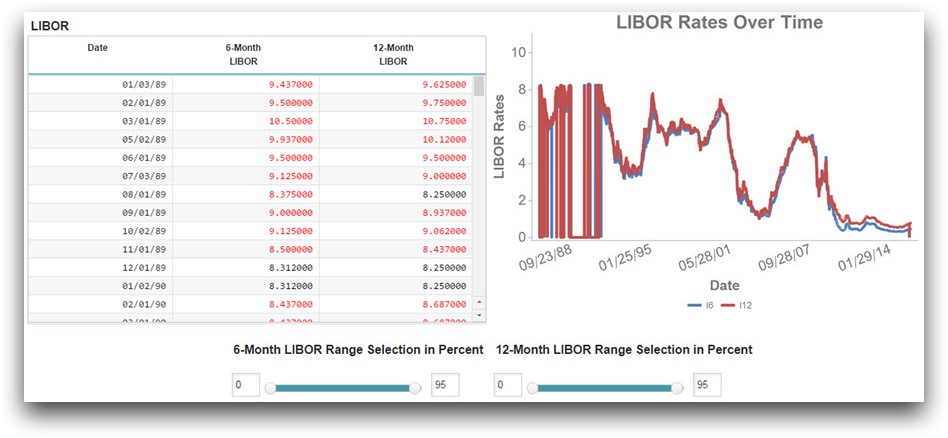
<meta>empty
</meta>
<defblock name="repeat">
  <base table="pub.fin.econ.rates.libor"/>
  <willbe name="month" value="month(date)"/>
  <willbe name="year" value="year(date)"/>
  <sel value="g_first1(month,year;;)"/>
  <sel value="libor6m<>0|libor12m<>0"/>
  <sel value="date>19890101"/>
  <willbe name="tot_rows" value="n_"/>
  <willbe name="ind_rows" value="i_"/>
  <willbe name="sixmonthhigh" value="g_hi(;;libor6m)"/>
  <willbe name="twelvemonthhigh" value="g_hi(;;libor12m)"/>
  <willbe name="ninetofive" value="95"/>
</defblock>
<dynamic six_factor_left="0" six_factor_right="100" twelve_factor_left="0"
twelve_factor_right="100" num_rows="" max_found="0" b_6_l="0" b_6_r="10"
b_12_l="0" b_12_r="10">
  <do on_="init" value_1_="num_rows" col_1_="tot_rows" row_1_="1"
  value_2_="b_6_r" col_2_="sixmonthhigh" row_2_="1" value_3_="b_12_r"
  col_3_="twelvemonthhigh" row_3_="1" value_4_="max_found"
  col_4_="twelvemonthhigh" row_4_="1" value_5_="six_factor_right"
  col_5_="ninetofive" row_5_="1" value_6_="twelve_factor_right"
  col_6_="ninetofive" row_6_="1">
    <insert block="repeat"/>
  </do>
  <do onchange_="six_factor_left" value_="b_6_l" col_="libor6m">
    <insert block="repeat"/>
    <sort col="libor6m" dir="up"/>
    <sel value="ind_rows={floor(@six_factor_left*@num_rows/100)}+1"/>
  </do>
  <do onchange_="six_factor_right" value_="b_6_r" col_="libor6m">
    <insert block="repeat"/>
    <sort col="libor6m" dir="up"/>
    <sel value="ind_rows={floor(@six_factor_right*@num_rows/100)}-1"/>
  </do>
  <do onchange_="twelve_factor_left" value_="b_12_l" col_="libor12m">
    <insert block="repeat"/>
    <sort col="libor12m" dir="up"/>
    <sel value="ind_rows={floor(@twelve_factor_left*@num_rows/100)}+1"/>
  </do>
  <do onchange_="twelve_factor_right" value_="b_12_r" col_="libor12m">
    <insert block="repeat"/>
    <sort col="libor12m" dir="up"/>
    <sel value="ind_rows={floor(@twelve_factor_right*@num_rows/100)}-1"/>
  </do>
  <layout arrange_="v">
    <layout arrange_="h">
      <widget class_="grid" type_="scroll" label_="LIBOR"
      base_="pub.fin.econ.rates.libor" colstwtfgcolor_="libor6m,libor12m"
      fgcolorforcol_="libor6m_color,libor12m_color" rowcol_="0">
        <willbe name="month" value="month(date)"/>
        <willbe name="year" value="year(date)"/>
        <sel value="g_first1(month,year;;)"/>
        <sel value="libor6m<>0|libor12m<>0"/>
        <sel value="date>19890101"/>
        <sel value="libor6m<>10.68"/>
        <willbe name="libor6m_color" value="if(between(libor6m;
        {@b_6_l};{@b_6_r});'black';'red')"/>
        <willbe name="libor12m_color" value="if(between(libor12m;
        {@b_12_l};{@b_12_r});'black';'red')"/>
        <colord cols="date,libor6m,libor12m"/>
      </widget>
      <widget class_="graphics" label_="LIBOR Rates Over Time"
      base_="pub.fin.econ.rates.libor">
        <colord cols="date,libor6m,libor12m"/>
        <willbe name="index" value="n_"/>
        <willbe name="ref6" value="between(libor6m;{@b_6_l};{@b_6_r})"/>
        <willbe name="ref12" value="between(libor12m;{@b_12_l};{@b_12_r})"/>
        <willbe name="l6" value="if(ref6;libor6m;0)"/>
        <willbe name="l12" value="if(ref12;libor12m;0)"/>
        <graphspec>
          <chart type="line" title="LIBOR Rates Over Time">
            <data x="date" y="l6"/>
            <data x="date" y="l12"/>
            <axes xlabel="Date" ylabel="LIBOR Rates" ymax="{@max_found}"/>
            <legend hide="0"/>
            <ticks xrot="20"/>
          </chart>
        </graphspec>
      </widget>
    </layout>
    <layout arrange_="h" relpos_="267,425">
      <layout arrange_="v">
        <widget class_="text"
         text_="6-Month LIBOR Range Selection in Percent"
         style_="font-weight:bold;font-size:12pt;"/>
        <layout arrange_="h">
          <widget class_="field" inputwidth_="35"
          value_="@six_factor_left"/>
          <widget base_="pub.fin.econ.rates.libor" class_="slider"
          orientation_="horizontal" min_="0" max_="100"
          value_="@six_factor_left" tovalue_="@six_factor_right"/>
          <widget class_="field" inputwidth_="35"
          value_="@six_factor_right"/>
        </layout>
      </layout>
      <layout arrange_="v">
        <widget class_="text"
         text_="12-Month LIBOR Range Selection in Percent"
         style_="font-weight:bold;font-size:12pt;"/>
        <layout arrange_="h">
          <widget class_="field" inputwidth_="35"
           value_="@twelve_factor_left"/>
          <widget base_="pub.fin.econ.rates.libor" class_="slider"
          orientation_="horizontal" min_="0" max_="100"
          value_="@twelve_factor_left" tovalue_="@twelve_factor_right"/>
          <widget class_="field" inputwidth_="35"
           value_="@twelve_factor_right"/>
        </layout>
      </layout>
    </layout>
  </layout>
</dynamic>
Discussion
Conditional formatting in a grid widget is a useful way to provide visual feedback to an end user based on their interactions with the QuickApp. This solution uses values selected on a slider widget to determine the formatting of a grid, but input from any widget can be used.
This solution bases the selection of data on the values contained in certain percentiles. These
percentiles and the rows that contain values within them are found using four
<do> operations that occur when each slider is moved. An additional
<do> operation, that occurs when the QuickApp is started, initializes
all variables used within the code based on information contained in the data table. These
variables include a left and right value for each LIBOR rate slider and the max value for
each rate.
The objective of this recipe is to display values in the grid that meet a certain condition as
a different color than the values that do not meet the condition. To do this, you create a
series of reference columns that will contain the colors you want to apply to the values in
the grid. The values in these columns will be recalculated each time the selection from the
slider widget is changed. You can use the if and between
functions to conditionalize which values are assigned to each row for each computed column
so that if any value in a selected column lies between the left and right slider values. If
the value for the given data point is between the selected values, it should be formatted in
black font, otherwise, it should be formatted in red.
The screenshot below shows the final product. Notice the initial slider is set to select values between 0 and 95%, therefore all LIBOR rates contained in this range are formatted as black when the QuickApp is initialized.
Common errors
- min_ attribute must be an number between -0i and 0i
- The
min_andmax_attributes can take an integer or a variable that contains an integer. If you do not provide a valid entry you will get this error.To resolve this error, make sure an integer is provided for each value. Additionally, if a variable is being utilized, double check the value of the variable and make sure you are using the correct syntax when referencing the variable (i.e.,
min_="{@var}").
Further reading
If you would like to learn more about the functions and operations discussed in this recipe, click on the links below: