
Creating a table with clickable columns and rows
Using the clickable_ attribute in a QuickApp allows the user to interact
with the data table and select specific columns and rows. With this attribute, you can create a
clickable grid that displays the selected values in a chart.
Difficulty
Objective
You want to give the end user the option to select the data they want to display in a chart by clicking on rows and columns in a table. .
Solution
<dynamic pkgcolval="{pkg(;)}" go="0" back="" colvar="zipcode" valvar="">
  <do onchange_="pkgcolval">
    <if test="{'{pkg_get(@pkgcolval;'name')}'<>''}">
      <set go="1"/>
      <set valvar="28117"/>
    </if>
  </do>
  <layout arrange_="h">
    <layout arrange_="v">
      <widget class_="grid" type_="scroll"
      clickablecolhead_="meantempi,meanpressurem,meanwspdi"
      pkgcolvalue_="@pkgcolval"
      height_="350" base_="pub.demo.weather.wunderground.observed_daily"
      clickable_="zipcode" value_="@valvar">
        <sel value="date>20130600"/>
        <colord cols="zipcode,date,meantempi,meanpressurem,meanwspdi"/>
      </widget>
      <widget class_="graphics" invmode_="hide" require_="{@go}"
      base_="pub.demo.weather.wunderground.observed_daily">
        <sel value="date>20130600"/>
        <sel value="{@colvar}={@valvar}"/>
        <graphspec width="600" height_="375">
          <chart type="line" samples="1000"
           title="{pkg_get(@pkgcolval;'label')} over time">
            <data x="date" y="{pkg_get(@pkgcolval;'name')}"/>
            <legend hide="1"/>
            <axes xlabel="Date" ylabel="{pkg_get(@pkgcolval;'label')}"/>
            <ticks xrot="25"/>
          </chart>
        </graphspec>
      </widget>
    </layout>
    <widget class_="button" text_="Go Back" invmode_="hide"
    require_="{@go}" type_="set" value_="@go" newvalue_="0"/>
  </layout>
</dynamic>
Discussion
Creating a clickable grid allows the end user to have more interaction with the table. If a chart is created using the information in the table, the user is then able to select which information should be displayed. This creates a versatile widget where the user has the ability to view different data combinations in a chart.
This solution uses three variables, pkgcolval, colvar, and
valvar, to define the data that is displayed in the chart.
colvar contains the column name of which values will become clickable
using the clickable_ attribute in the grid widget. valvar
holds the value that the user selects from this column in the table. Column headers can
also be made clickable by passing column names to the clickablecolhead_
attribute. When a column header is selected by the user, a package is created with all of
the information about the column and is stored in the pkgcolval variable.
This makes it so the column name and label can be accessed by the chart.
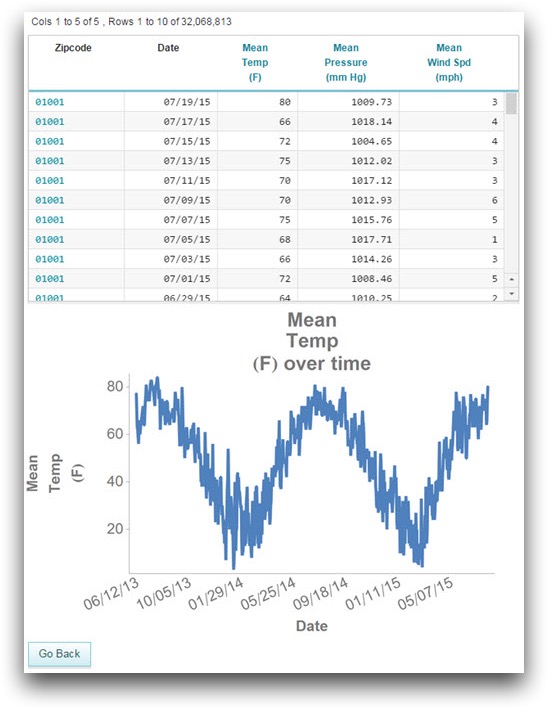
After the user clicks on the desired data, the QuickApp should look like the following image.
Common errors
- Undefined @variable referred to in: zipcode={@valvar}
- Upon selecting a column header, if a row value is not selected first, you will see
this error.
Simply initializing the
valvarvariable in the<dynamic>will not fix this error. Instead, when a column header is selected a<do onchange_="@pkgcolval">operation occurs to temporarily assign a value tovalvaruntil the user makes a different selection.
Further reading
If you would like to learn more about the functions and operations discussed in this recipe, click on the links below: