
Explore the 1010data Trillion-Row Spreadsheet
The 1010data Trillion-Row Spreadsheet is a graphical user interface (GUI) that allows you to visually interact with your data. Explore the GUI to learn how to use some of the most common user interface elements in 1010data.
1010data gives you several options to interact with the system and analyze your data, but when you first get started, you are likely going to spend most of your time in the Trillion-Row Spreadsheet. The 1010data GUI is a browser-based interface that works similarly to many spreadsheet applications, such as Microsoft® Excel®. The interface uses many elements you may already be familiar with, such as folders, navigation icons, and menus.
Throughout this tutorial, the Sales Item Detail table (pub.demo.retail.item) is used to introduce you to the major elements in the 1010data GUI.
To explore the 1010data Trillion-Row Spreadsheet:
-
Access the 1010data Login page by doing one of the
following:
- From the 1010data home page, click Client Login at the upper right side of the page.
- In your Internet browser address bar, enter https://www.1010data.com/main/login and press Enter.
The 1010data Login page appears.
-
Enter your 1010data Username and
Password, then click
Login.
Logging in may take several minutes.Note: If you cannot remember your password, you can reset it. Click Forgot your password? and follow the instructions on the Password Reset page.
The 1010data GUI appears.
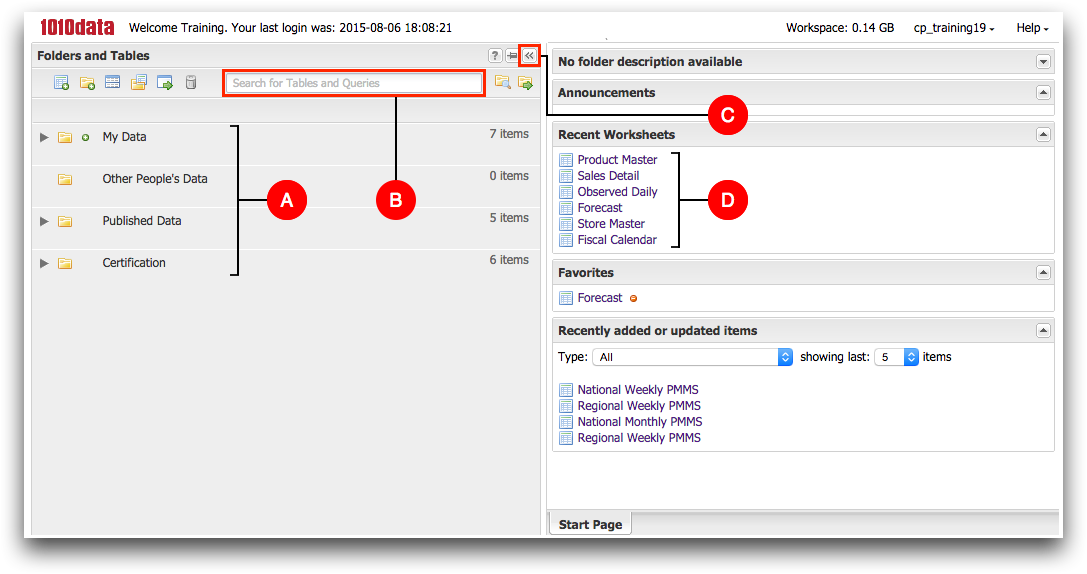
- A. Folders and Tables
- The folders and tables visible to you are displayed in the
collapsible Folders and Tables browser on
the left side of the screen. Within the Folders and
Tables browser, you can open tables, which are
organized in folders.
A table is the permanent, unchanging version of the data that is saved on the server. When you open a table in the spreadsheet interface and perform an action or query, it becomes a worksheet. A worksheet is a working copy of the table. In worksheets, you can work with and manipulate your data. You can save the worksheet permanently as a table. You can also save your data analysis as a Quick Query, which can be applied to the original table at any time.
- B. Search
- The search field in the Folders and Tables toolbar allows you to search for tables. If you know the name of a table you want to open, you can open it directly from the search field.
- C. Fold/Unfold
- To hide the Folders and Tables browser,
click the Fold (
 ) icon at the upper-right side of the
browser pane. Click the Unfold (
) icon at the upper-right side of the
browser pane. Click the Unfold ( ) icon to expand the
Folders and Tables browser when it is
hidden.
) icon to expand the
Folders and Tables browser when it is
hidden. - D. Recent Worksheets
- Your recent worksheets are displayed as links in the
Recent Worksheets section on the
Start Page. Click a link in this
section to open a worksheet in its most recent state.
The Recent Worksheets section does not contain links the first time you log in.
-
In the Folders and Tables browser, to the left of the
Published Data folder, click the
Expand (
 )
icon.
The Published Data folder opens, revealing additional folders.Note: You can also double-click a folder to open it.
)
icon.
The Published Data folder opens, revealing additional folders.Note: You can also double-click a folder to open it. -
Double-click the Demo folder and then double-click the
Retail folder.
The Retail folder opens, revealing the tables contained in the folder.
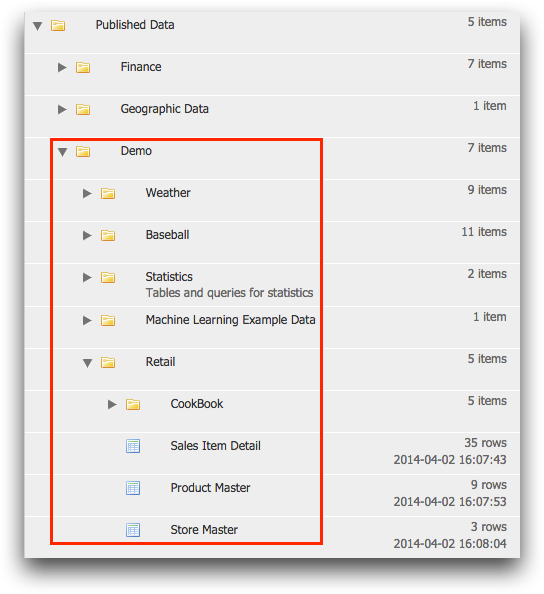
In the image above, the red box outlines the Demo folder and its contents. The Retail folder is open. In that folder, you will find a table titled Sales Item Detail.
-
Double-click the Sales Item Detail table.
The Folders and Tables browser hides, and the Sales Item Detail table opens in a new tab.
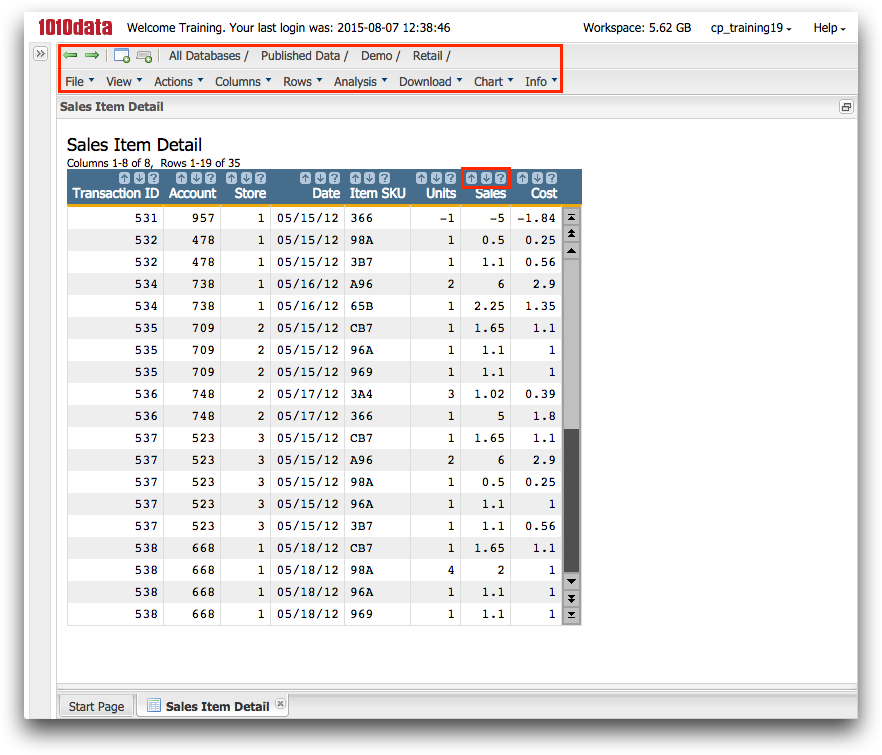
This is the basic view of a table in 1010data. At the top of the screen, outlined within the larger red rectangle, are the Go Back (
 ) and
Go Forward (
) and
Go Forward ( )
icons. Use these icons to move backward or forward through the steps of your
analysis. The path to the table in which you are currently working appears
to the right of these icons. You can click any part of the path to open that
folder in the Folders and Tables browser.
)
icons. Use these icons to move backward or forward through the steps of your
analysis. The path to the table in which you are currently working appears
to the right of these icons. You can click any part of the path to open that
folder in the Folders and Tables browser.Below the Go Back and Go Forward icons is the Tables and Worksheets menu bar. The table below provides a description of each menu in the menu bar and its available options.
Table 1. Tables and Worksheets menu bar Menus Menu description File Options for opening, closing, and saving common 1010data items such as tables and queries. View Options for how to view your 1010data tables, worksheets, and QuickApps. You can set your preferences here. Actions Options to edit and undo 1010data actions such as row selections and sorts. Columns Options for working with columns. You can go to a specific column, create computed columns, and link other tables and worksheets to your current table here. Rows Options for interacting with rows in your current table. You can go to a specific row, find rows, and select rows here. Analysis Quick access to perform summaries, tabulations, and cross tabulations. Download Download options to save your data locally in a variety of file types such as Excel, CSV, and XML. Chart Options for creating charts based on your data analysis. Info Provides detailed information about the current table. In the previous image, the smaller red rectangle surrounds the Sort Ascending (
 ), Sort Descending (
 ), and Column Information
(
), and Column Information
( ) icons. The sort icons are used to sort the
table by the data in the selected column. The Column
Information icon is used to display information about the
column.
) icons. The sort icons are used to sort the
table by the data in the selected column. The Column
Information icon is used to display information about the
column. -
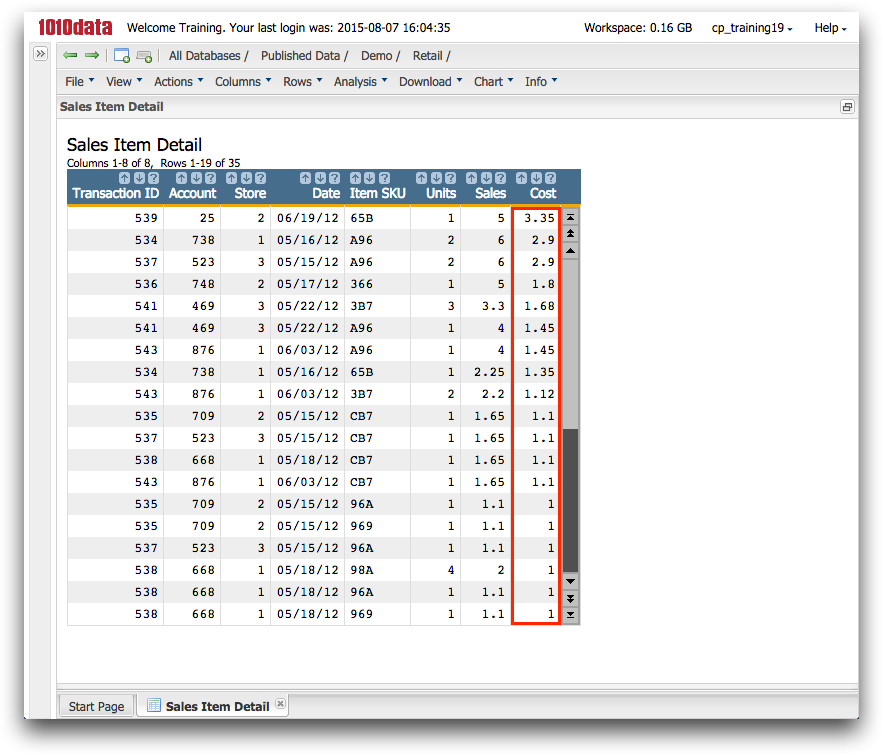
Click the Sort Descending icon in the
Cost column.
1010data sorts the table based on the Cost column in descending order.
At this point, the table becomes a worksheet because an action was performed on the table.
 Note: Sorting is very system-resource intensive. As a best practice, do not sort your table or worksheet until the data is narrowed down to a manageable size. Instead of sorting, first perform a tabulation or select a narrow range of rows.
 -
Click the Column Information icon in the
Sales column.
A window opens and displays information about the Sales column.
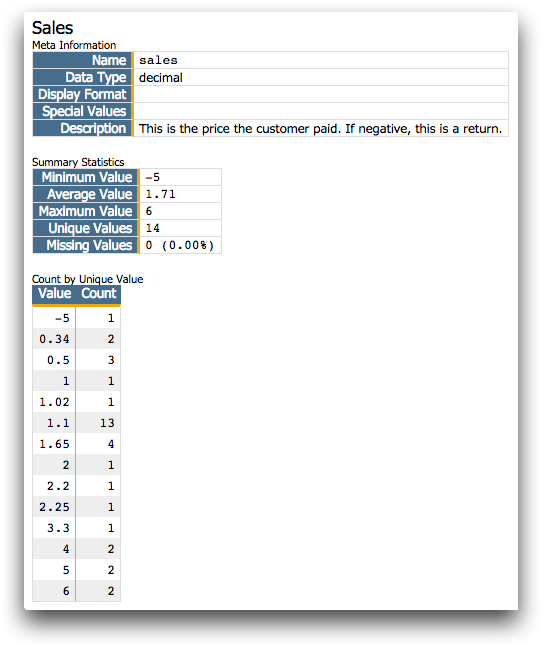
Clicking the Column Information icon at the top of a column provides you with a considerable amount of useful information. You can use it in the analysis of your data, especially when writing Macro Language code. If you find yourself in a position where you need information about a particular column, this is an excellent place to start.
-
Close the window that contains the Sales column
information.
The Sales Item Detail worksheet is displayed.
A scroll bar, similar to the one outlined in red in the image above, appears on the right side of the worksheet if the screen cannot accommodate all of the rows. The scroll bar in the 1010data GUI allows you to navigate through the data in your worksheet.
-
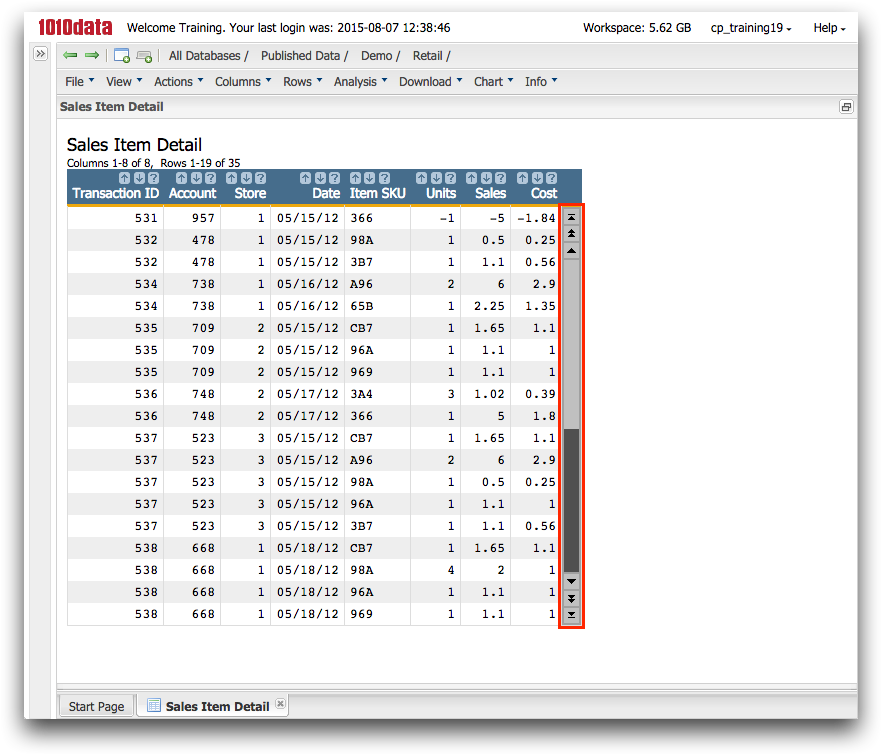
If there is a scroll bar on the right side of your worksheet, click the
Scroll to end (
 )
icon.
Note: If a scroll bar is not displayed in your worksheet, all available data is already displayed; no additional rows of data exist.
)
icon.
Note: If a scroll bar is not displayed in your worksheet, all available data is already displayed; no additional rows of data exist.1010data scrolls to display the last row of data in your worksheet.
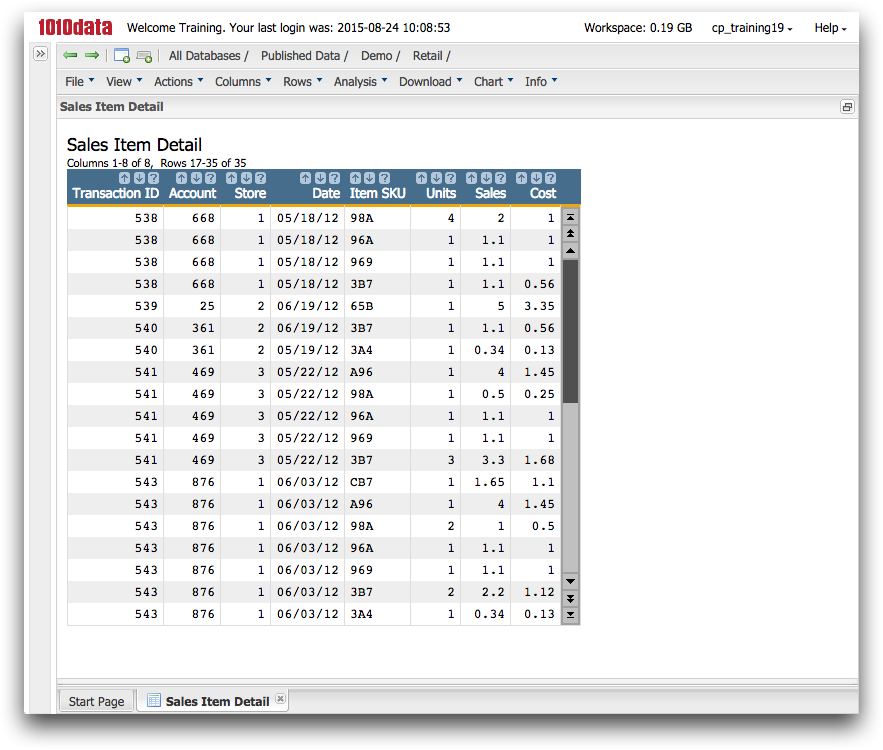
For the purposes of this tutorial, we created a very small data set to illustrate the concepts in this topic. In this case, you can scroll through the data in just a few seconds. However, your tables may contain billions of rows. As you work with the Trillion-Row Spreadsheet, keep in mind that scrolling may not be the most effective way to get to a particular section of data. For that, a better method is to use the Select Rows menu item, which is covered in Select rows.
The following table provides a short description of each icon in the scroll bar.
Table 2. Scroll bar icons Scroll icon Description Scroll to top (  )
)Jumps to the very beginning of the table. Back one page (  )
)Moves the visible rows of data in a table up by an entire page. In other words, the first non-visible row in the table becomes the first visible row. Back one row (  )
)Moves the visible rows of data in a table up by one row. Forward one row (  )
)Moves the visible rows of data in a table down by one row. Forward one page (  )
)Moves the visible rows of data in a table down by an entire page. In other words, the first non-visible row in the table becomes the first visible row. Scroll to end ( )Jumps to the very end of the table. Note: You can go directly to any point in the table by clicking within the darker gray parts of the scroll bar. The top edge of the slide bar moves to the point where you click. -
Click .
1010data displays the Select and Rearrange Columns dialog.
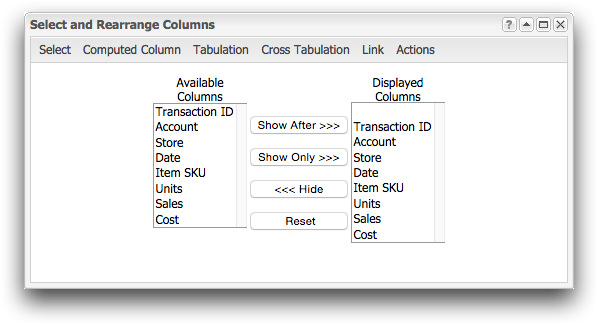
The Available Columns list shows all the columns contained in your table, whether they are currently displayed in your worksheet or not. The Displayed Columns list shows the columns that are currently visible in your worksheet and in the order they are displayed left to right. Using this dialog, you can rearrange and hide columns in your worksheet.
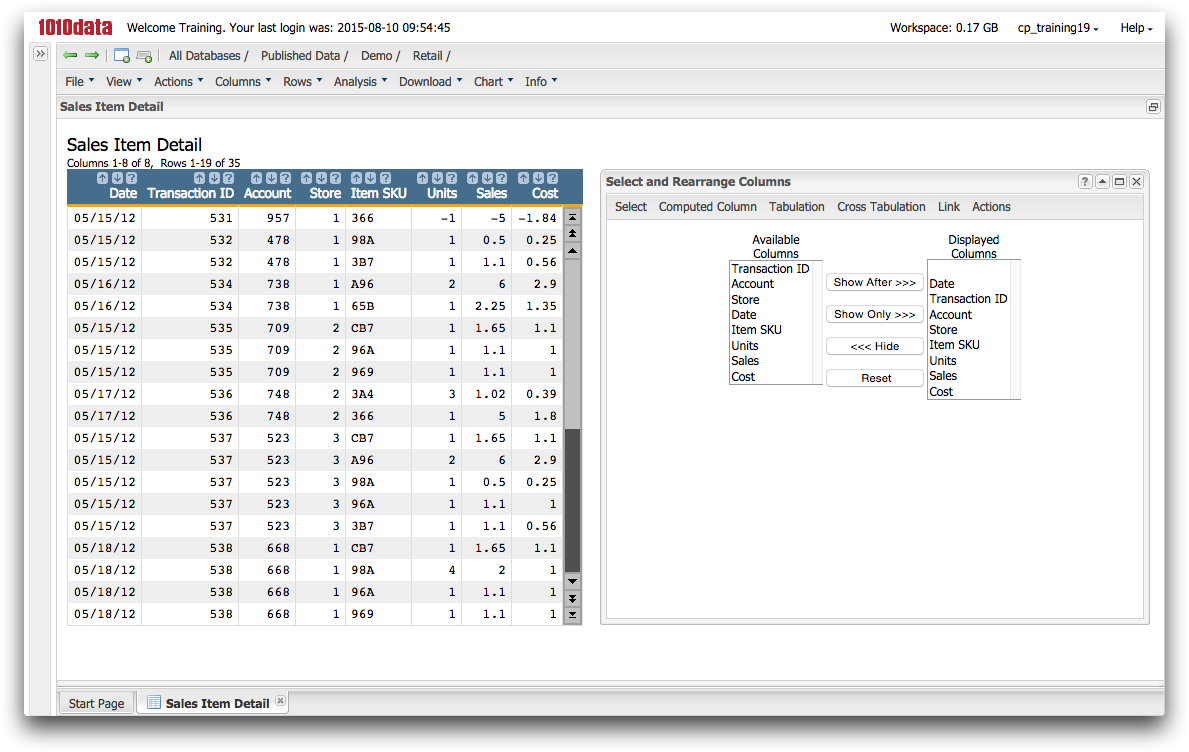
-
To move the Date column, complete the following
steps:
The Date column moves to the top of the list and is displayed as the first column in the worksheet.
-
To remove the Cost column, complete the following:
- In the Displayed Columns list, click Cost.
- Click Hide.
The Cost column is removed from the Displayed Columns list and no longer appears in the worksheet.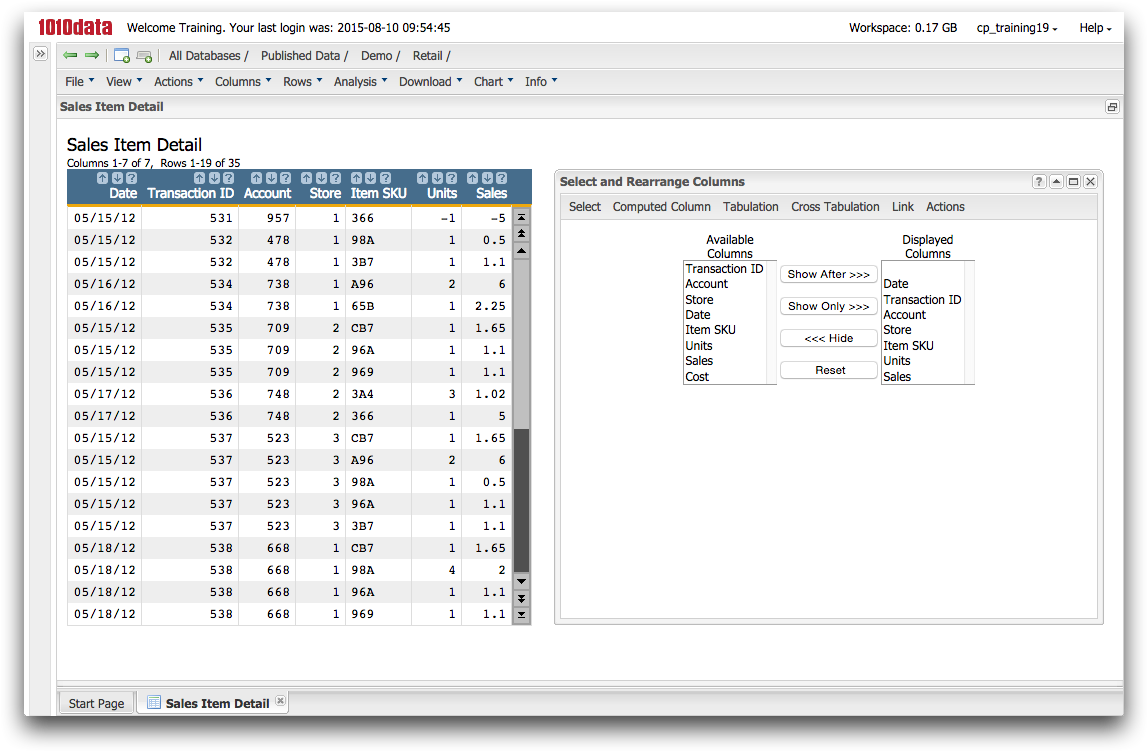
-
When you are finished with this tutorial, close the Sales Item
Detail worksheet by clicking the Close
(
 )
icon in the Sales Item Detail tab.
)
icon in the Sales Item Detail tab.
For more information about the 1010data GUI, see User Basics in the 1010data User's Guide.