
Select rows
Selecting rows is one of the most basic tasks in 1010data. Use row selection to isolate data that is important to your analysis and create more efficient queries.
Whether you are working with a table that is very small or very large, the first step to answering an analytical question is to narrow down the data you are working with so you see only the pieces of information that apply. While there are many ways to do this, the most basic is a row selection.
The purpose of row selection is to reduce a large collection of general data to a smaller collection of data specific to the question being asked. For example, a question might be "Which store in our chain had the highest sales in December?" Another could be "What were the highest and lowest sales figures for a single transaction?" In both cases, you start with all of your data to answer a question that only requires a subset of that data.
When you work with very large data sets like those typically found in 1010data, the order in which you perform your operations on the data makes a difference in how fast the system can complete those operations. If you make the largest selection that eliminates the most data first, then the subsequent operations you perform finish faster because 1010data does not need to work with as much information. As a best practice, if your data contains columns with date- or time-related information, that is generally the best place to start. However, the largest selection may be something other than date or time information and is based on your data and the analysis you want to perform.
This tutorial explains how to perform a series of row selections to reduce the amount of information in the Sales Item Detail data set.
To perform a row selection:
-
Open the Sales Item Detail table
(pub.demo.retail.item).
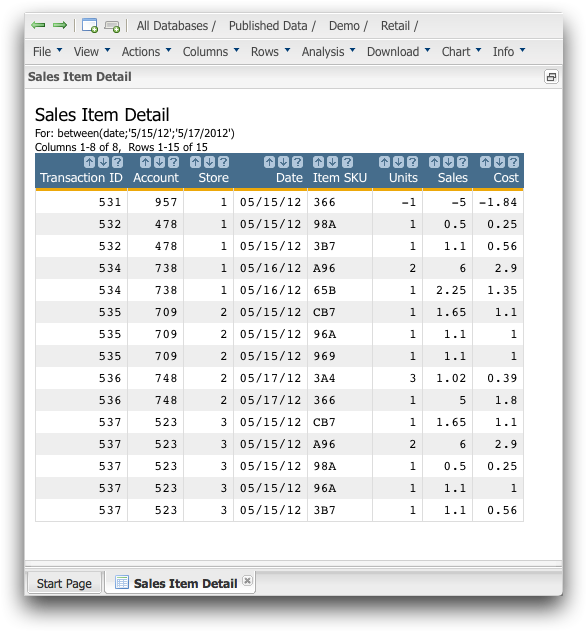
The name of the Sales Item Detail table is pub.demo.retail.item. The location of the table is provided within the file name. In this case, the table is located in the following folder: .1010data displays the Sales Item Detail table. It contains 35 rows of data, of which only a limited number display in the image below.
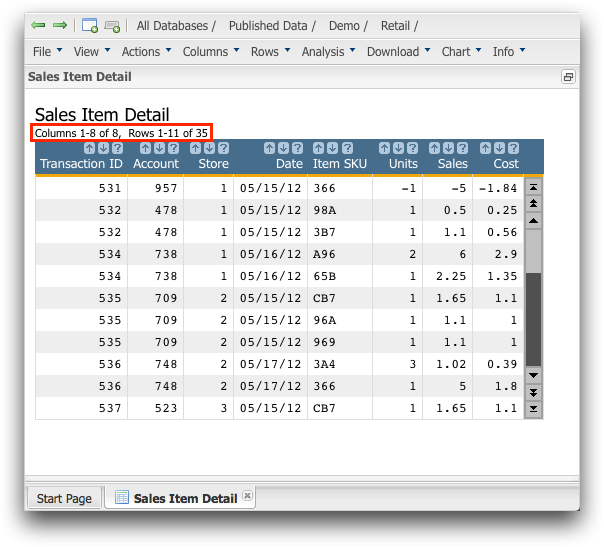
For the purposes of this tutorial, we developed a smaller data set so you can see the changes being made to the data. Even though performing real analyses require much larger data sets, all the principles in this tutorial apply.
-
Click .
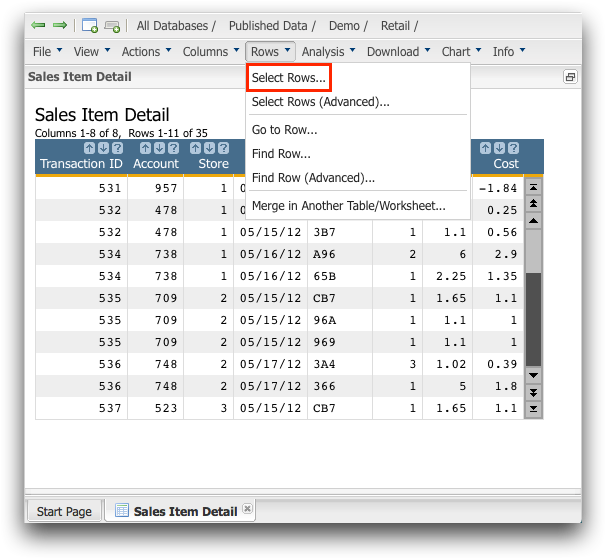 1010data displays the Select Rows dialog.
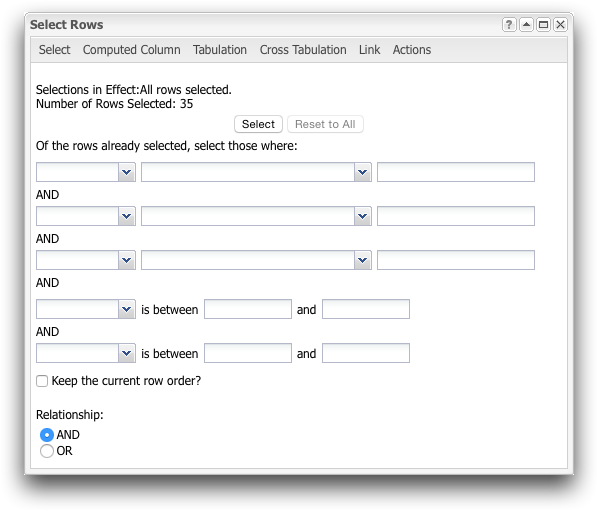
When selecting rows in 1010data, you should always make the selection that eliminates the largest amount of data first. This almost always means your first selection should be a date range. For the purposes of this tutorial, limit the data to May 15, 2012 through May 17, 2012.
-
From the drop-down list preceding the first is between
label, select Date. In the next field, enter
05/15/12, and in the last field, enter
5/17/2012.
Dates entered must exist in the data set.
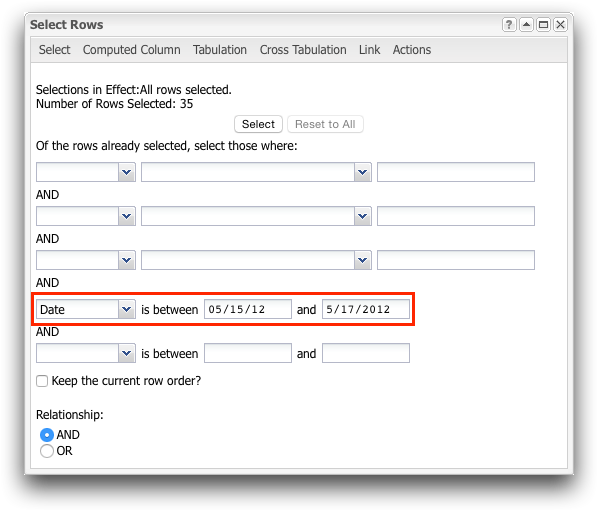 Note: A row selection specified using the in between criteria is inclusive, meaning rows with the values entered in the corresponding fields are included in the results.
You may have noticed that different date formats were used in each field. Different formats are valid in 1010data, so you can use the date format that you prefer.
-
Click Select.
1010data displays the results of your selection.
Congratulations, you just performed your first row selection in 1010data! As you can see in the image above, the amount of data in the table is reduced by more than half.
What if you want to see information about a particular store? To do this, again use the Select Rows dialog and enter additional comparison criteria. In this case, you can enter a store number to limit the data to the rows that identify a specific store.
-
In the first row of the Select Rows dialog, do the
following:
- From the first drop-down list, select Store.
- From the second drop-down list, select has the value(s).
- In the last field, enter 2.
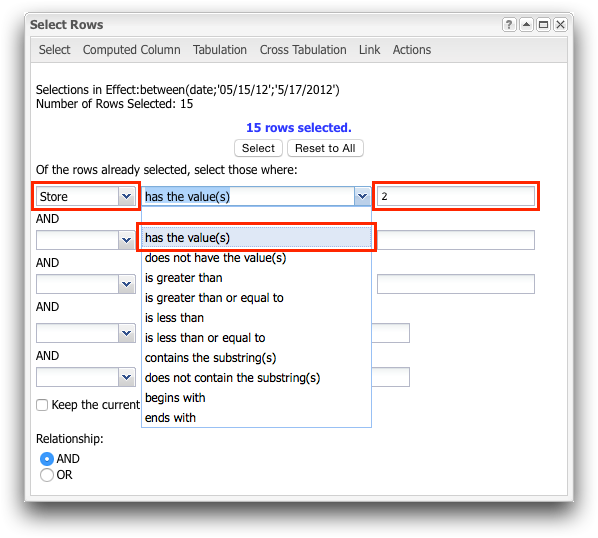
These selections indicate that you want to see only rows for store 2. If the second comparison option, does not have the value(s), is selected, all of the stores in the table except store 2 display.
If you want to include more than one value (more than a single store in the example above), separate the values with a space.
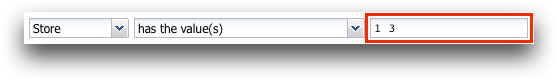
The example above displays results for both store 1 and store 3. Searching for multiple values is useful when working with information like product numbers.
Now that all of the information you need for your results is entered, you can perform the selection.
-
Click Select.
1010data displays the results of your selection.
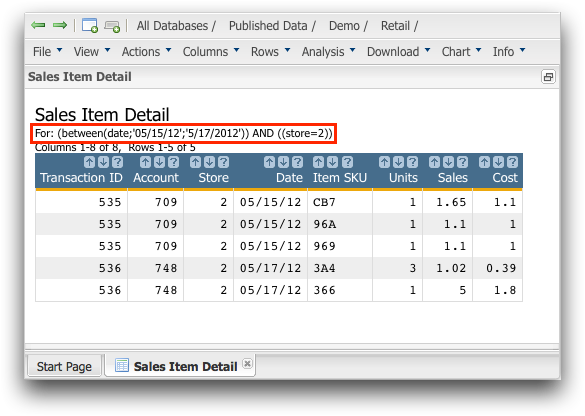
In just a few minutes, you narrowed the data down from 35 rows to 5. That is less than one-seventh of the original data. Also, notice that the worksheet indicates the selections you already performed (outlined in red above). This can help prevent duplicating effort when making additional selections.
You can also quickly perform a basic row selection directly from the worksheet by right-clicking any cell and choosing an option that appears in a pop-up menu.
-
Right-click the cell in the first row of the Date
column.
1010data displays a pop-up menu.
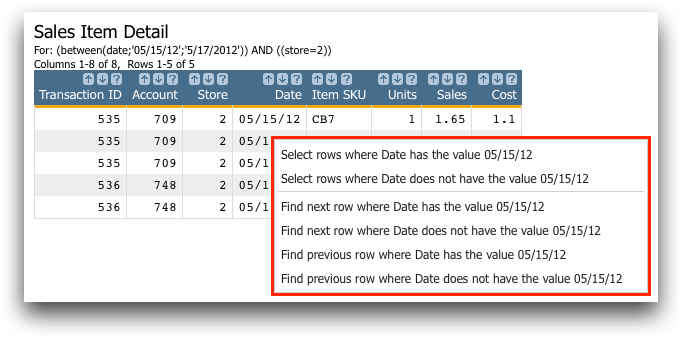
By right-clicking a cell in the worksheet, you can choose from several row selection options that pertain to that cell. Take a look at the available options when you right-click an Account cell.
-
Right-click the cell in the first row of the Account
column.
1010data displays a pop-up menu.
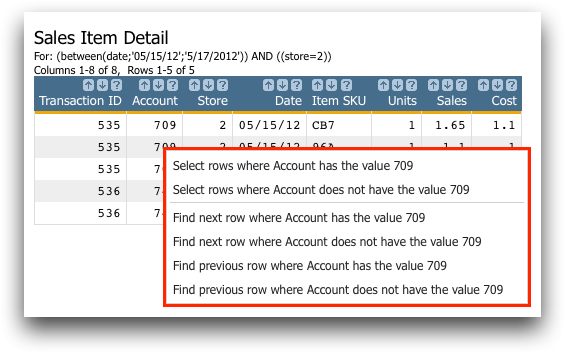
As you can see, when you right-click a cell in the Account column, the options are related to Account and not Date. If you need to perform a simple selection, this is a great way to quickly select rows.
For more information about selecting rows, see Rows in the 1010data User's Guide.