
Perform a tabulation
A tabulation summarizes large amounts of data into a small, easy-to-read table. Perform a tabulation to group the values in a column based on the values in another column.
A tabulation is a great place to start when you want to get a feel for what all those billions of rows of data in your table really mean. Tabulations allow you to calculate various metrics, such as the sum, average, or highest value of a particular column, grouping those calculations based on common values in one or more other columns. For instance, in a table containing weather data, you could calculate the highest temperature during the year for every unique combination of ZIP Code™and month in the table.
In this tutorial, you will perform a tabulation on the Sales Item Detail table to find the total amount of sales for each of three stores in a chain. You will then perform a separate tabulation to find the total amount of sales and units for each transaction. Finally, you will export the tabulation to Excel.
To perform a tabulation:
-
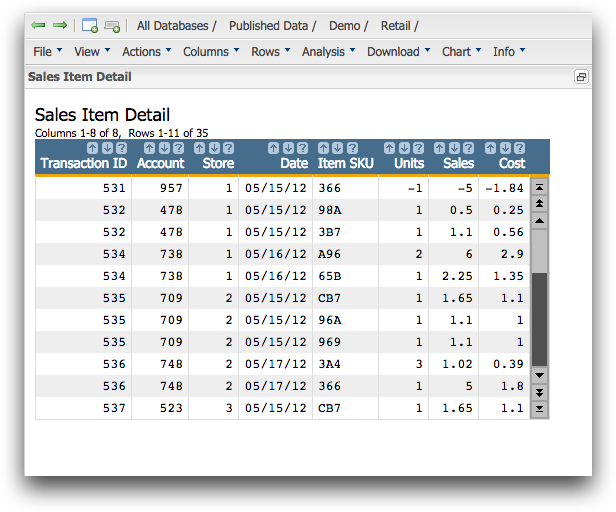
Open the Sales Item Detail table
(pub.demo.retail.item).
1010data displays the Sales Item Detail table.
-
Click .
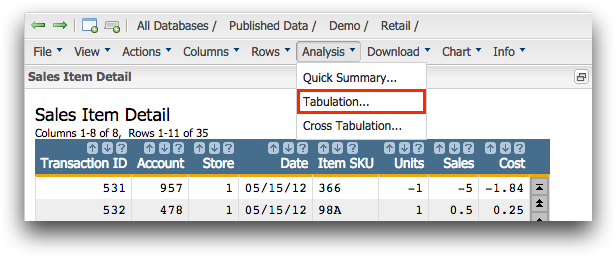 1010data displays the Tabulation dialog.
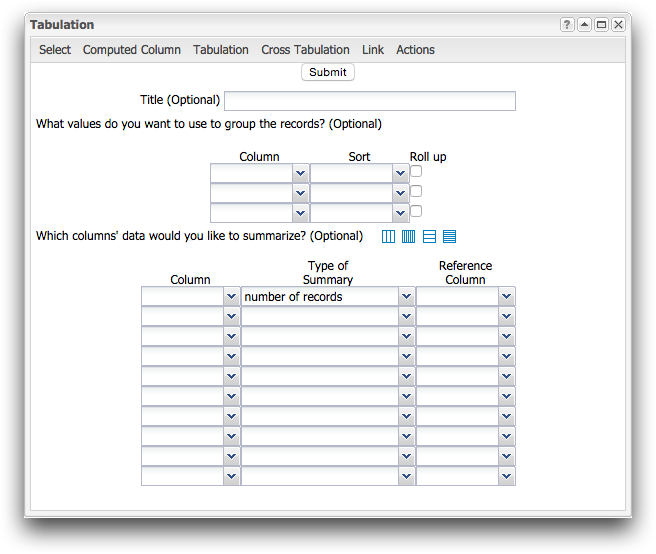
The Tabulation dialog allows you to create a basic tabulation. By default, columns in the resultant worksheet are named
t0,t1,t2, and so on. You can give tabulated columns more meaningful names by using a different view within the Tabulation dialog. -
Click the Show all inputs sequentially (
 ) icon.
1010data displays fields for naming and formatting the columns of the new tabulation.
) icon.
1010data displays fields for naming and formatting the columns of the new tabulation.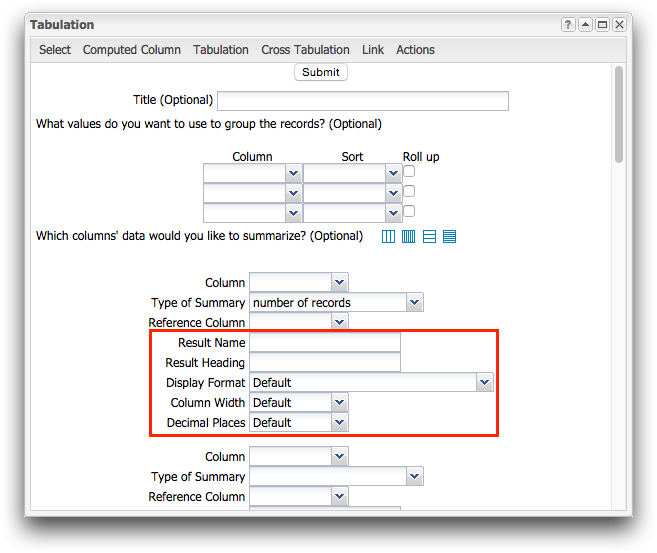
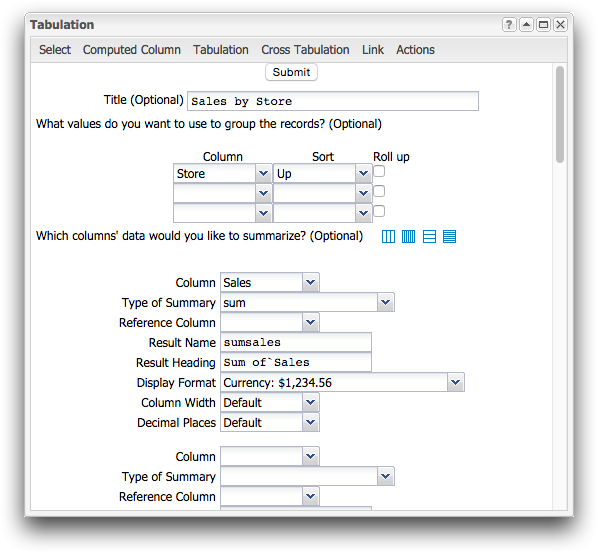
Next, choose the column by which you want to group the information. In other words, how do you want to subtotal the data. When performing a tabulation, a helpful question to ask yourself is "What values do I want to use to group the records?" Since you want to find the total amount of sales for each store, you should group the information by the Store column. Grouping is a way of pooling all the records for a single entity or value (in this case, a store) into a single entry in the table.
Now that the data grouping is set, choose the data you want to summarize.
-
Summarize the total sales for each store.
Under the Which columns' data would you like to summarize? section, complete the following:
Column Select Sales. This selection chooses the column of data you want to act on. In this instance, you want to calculate the total sales.
Type of Summary Select Sum. This selection chooses the action you want to perform on the selected column. In this case, you want to summarize the data in the sales column.
Reference Column Leave this field blank; it is used for advanced summarization functions, such as weighted averages and correlations. For more information, see Types of Summarizations for Tabulations in the 1010data User's Guide. Result Name Enter sumsales. This is the column name. Remember, 1010data column names must begin with an alphabetic character, may only contain alphanumeric characters or underscores, and may not contain any spaces or other special characters.
Result Heading Enter Sum of`Sales. This is the column label. For easier readability, column labels may contain any combination of uppercase and lowercase letters, numbers, spaces, and special characters. The backtick ( ` ) special character is used to break the column label text line into multiple lines. In this case, "Sum of" will be on the first line of the column label and "Sales" will be on the second line.
Display Format Select Currency: $1,234.56. Since your totals will be dollar amounts, this option is selected. When currency is selected, 1010data adds the dollar sign and uses two decimal places for each tabulated sales value.
Column Width Select Default. Decimal Places Select Default. Because you selected currency above, 1010data will automatically use two decimal places.
Now that you have selected the data you want to group by and the data you want to summarize, generate the tabulation.
-
Click Submit.
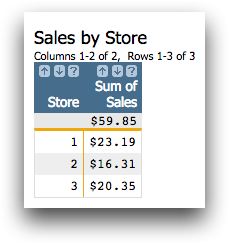
1010data displays the results of your tabulation.
 Note: In the image above, the column heading (Sum of Sales) is at the top of the column. If you prefer, you can change this to show the column name instead. For details, see User Interface Preferences in the 1010data User's Guide.
Notice that there is a row of data in gray at the top of the worksheet. This row shows the totals for each column of summarized data. The three fictional stores generated $59.85 in sales with store 1 generating $23.19, store 2 generating $16.31, and store 3 generating $20.35. While this tabulation might not seem very useful for a chain of three stores, it becomes much more useful when summarizing chains with hundreds, or even thousands, of stores.
Now, you will take a look at a slightly more complex example of a tabulation.
Instead of looking at the total sales per store, you will determine the sales totals for each transaction in the Sales Item Detail table. However, you also want to know at which store any given transaction took place, and also the total number of items in each transaction. The objective is to have a summary table that shows you the transaction ID, store, sum of sales, and total units for each transaction.
-
Click the Go Back (
 ) icon in
the Tables and Worksheets toolbar.
1010data displays the original Sales Item Detail table.
) icon in
the Tables and Worksheets toolbar.
1010data displays the original Sales Item Detail table.
Just as before, in the Tabulation dialog, give your tabulation a title and then start by selecting a column to group your data. In this case, you want to see the total sales figures for each transaction. You also want to know which store recorded each of the transactions in the table, so you should also group by store.
Now that you have grouped your data, first by transaction, then by store, you can choose the data you want to summarize. In this example, you are still summarizing sales, so you can make the same exact selection you made in the last example.
-
Summarize the total sales for each transaction.
Under the Which columns' data would you like to summarize? section, from the first group of fields, complete the following:
Column Select Sales. This selection chooses the column of data you want to act on. In this instance, you want to calculate the total sales.
Type of Summary Select Sum. This selection chooses the action you want to perform on the selected column. In this case, you want to summarize the data in the sales column.
Reference Column Leave this field blank. Result Name Enter sumsales. Result Heading Enter Sum of`Sales. Display Format Select Currency: $1,234.56. Column Width Select Default. Decimal Places Select Default. 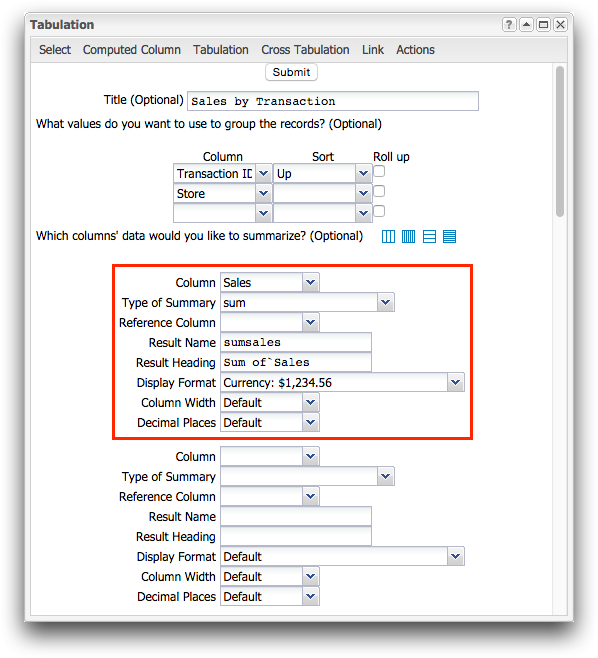
-
Summarize the total items in each transaction.
Under the Which columns' data would you like to summarize? section, from the second group of fields, complete the following:
Column Select Units. This selection is chosen because you want to determine the number of units.
Type of Summary Select Sum. This selection is chosen because you want to see the total number of units in each transaction.
Reference Column Leave this field blank. Result Name Enter totunits. Result Heading Enter Total Units. Display Format Select Default. Column Width Select Default. Decimal Places Select Default. 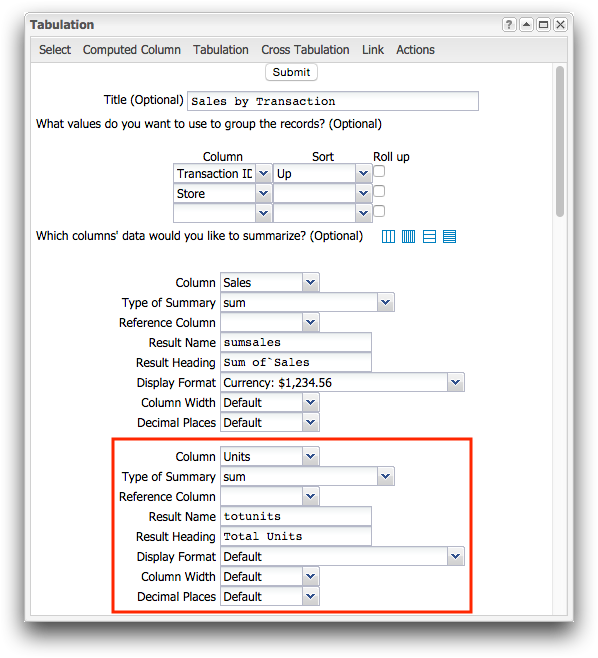
Now that you have selected the data you want to group by and the data you want to summarize, generate the tabulation.
-
Click Submit.
1010data displays the results of your tabulation.
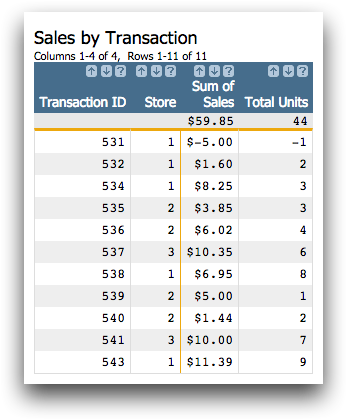
Notice that in the new summary, the total sales figure in the gray row at the top of the worksheet remains the same. However, instead of the total sales by store, 1010data displays the total sales figure for each transaction and the store at which the transaction took place. In addition, the tabulation includes the total number of units sold in every transaction to provide a little more insight into volume. This provides you with an extra layer of detail or granularity in your results. Yet, the new table is still much easier to read and understand than the original Sales Item Detail table.
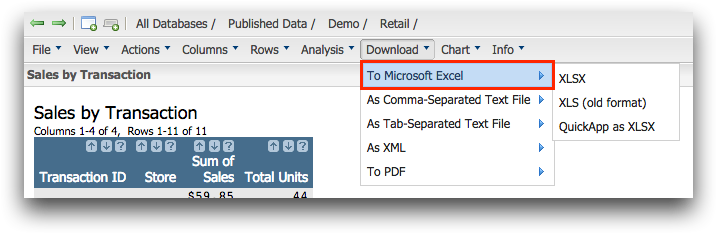
The final step in this tutorial is to download your results in a Microsoft Excel workbook file.
-
Click and select one of the following from the menu:
- XLSX
Select this menu item to download the tabulation in a workbook file for Excel 2007 and newer.
- XLS
Select this menu item to download the tabulation in a workbook file for Excel 2003 and earlier.
 1010data saves the tabulation to your computer as download.xlsor download.xlsx.Note: Depending on the browser you are using, you may be prompted to open or save the file. If you are prompted, save the file.
 - XLSX
For more information about tabulations, see Summarizations and Tabulations in the 1010data User's Guide.