
Cross tabulations
A cross tabulation allows you to summarize the values in a column based on the values in two or more other columns and display the result as a matrix.
In the tutorials in this section, you will learn how to perform a cross tabulation. Once you have performed a cross tabulation, you will learn how to create a computed column from your cross tabulation.
A cross tabulation can help you gain granularity from a summary without losing the highest level of data summarization. For example, in addition to finding the total amount of sales for each store in your chain, you can also obtain the sales figures for the individual departments within each store and how they compare to the total.
To illustrate this concept, shown below is the Sales by Store summary from Perform a tabulation.
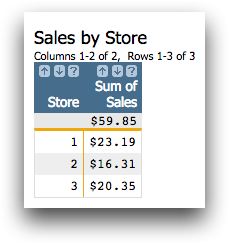
This result was reached simply by adding up the total sales for each store and assigning the total for each result to a single row in the table. Another way to think about this is that you created a "bucket" for each store and placed the amount of each transaction in the bucket of the store where the transaction took place. What if you want to know which departments contributed to the sales of each store?
The best way to get this information, without losing sales totals for each store, is to perform a cross tabulation. Effectively, a cross tabulation groups on a second metric and summarizes it, placing the data into one column for each unique value in the group. Each row will contain sales figures for each store, and a new set of columns will be created to show the sales totals for each department.
For additional information about cross tabulations, see Summarizations and Tabulations in the 1010data User's Guide.