Organize the content
You can organize the content of your QuickApp using any of the predefined layout types, such as a splitter layout, which allows you to divide the QuickApp into resizable areas.
The QuickApp framework provides a number of predefined layout types. For instance, a tabbed panel allows you to organize your content on separate tabs. A collapsible layout presents information in sections that can be expanded or collapsed by the user.
A splitter layout allows you to divide your content into multiple areas that can be displayed simultaneously. You can specify the percentage of space allocated to each area contained within a splitter layout, and the dividers that separate the sections can be moved by the user to adjust the space dynamically. In addition, each section can be expanded or collapsed completely.
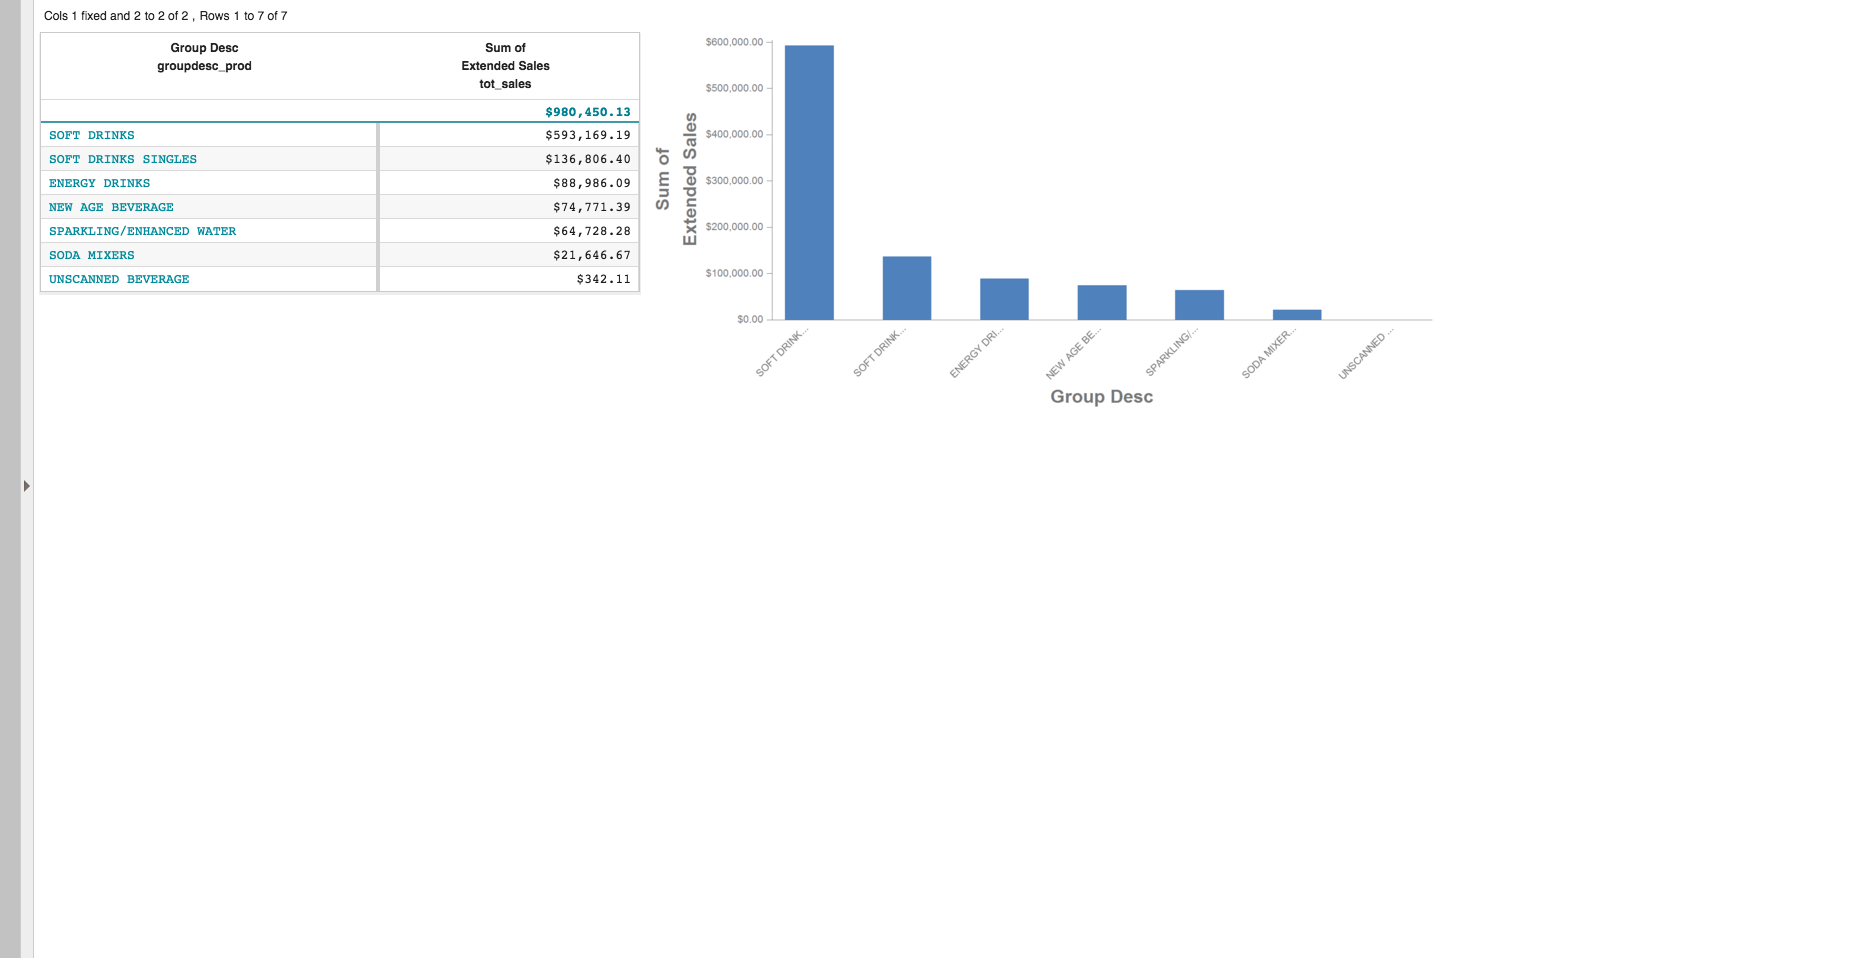
For this example, suppose you want to separate the area that contains the drop-down widgets and Run button from the grid, list, and both graphics widgets. A splitter layout would make it possible for the user to collapse the panel that contains the drop-down widgets once the selections have been made.
To organize the content using a splitter layout:
You can grab the handle on the splitter ( ) and move the divider to the
left or right to resize the panels, or you use the arrows to collapse or expand the
sections.
Cumulative QuickApp code
The Macro Language code for the QuickApp up to this point is:
<defblock name="sales_by_date" prod_table="" department="" group_by="">
  <link table2="{@prod_table}" col="sku" col2="sku"
   suffix="_prod" type="select">
    <sel value="dept={@department}"/>
  </link>
  <tabu label="Tabulation on Sales Detail" breaks="{@group_by}">
    <tcol source="xsales" fun="sum" name="tot_sales"
     label="Sum of`Extended Sales" format="type:currency"/>
  </tabu>
  <sort col="tot_sales" dir="down"/>
  <sel value="({@group_by} <> '')"/>
</defblock>
<dynamic selection="19" product_master="pub.doc.retail.product"
 sales_detail="pub.doc.retail.salesdetail" aggregate_by="groupdesc_prod"
 mode_="auto" display_chart="1" clicked_value="" list_title="PRODUCT LIST"
 list_selection="" startdate="20140101" enddate="20140131"
 item_title="SALES OVER TIME">
  <do onchange_="@aggregate_by,@selection">
    <set clicked_value=""/>
    <set list_selection=""/>
  </do>
  <do onchange_="@clicked_value">
    <set list_title="{@clicked_value} PRODUCT LIST"/>
    <set list_selection=""/>
  </do>
  <do onchange_="@list_selection" base_="{@product_master}"
   value_="@item_title" row_="1" col_="1"
   when_="{@list_selection <> ''}">
    <sel value="sku={@list_selection}"/>
    <colord cols="description"/>
  </do>
  <layout type_="splitter" width_="100%" height_="100%" arrange_="h">
    <layout background_="lightblue" border_="10" width_="20%">
      <widget class_="dropdown" base_="{@product_master}"
       inputwidth_="250" value_="@selection"
       label_="Department:" labelwidth_="75">
        <tabu label="Tabulation on Product Master" breaks="deptdesc">
          <break col="deptdesc" sort="up"/>
          <tcol source="dept" name="dept" fun="first"
           label="First`Department"/>
        </tabu>
        <colord cols="dept,deptdesc"/>
      </widget>
      <widget class_="dropdown" value_="@aggregate_by"
       label_="Aggregate by:" labelwidth_="75" inputwidth_="250">
        <table>groupdesc_prod,Group;brand_prod,Brand
        </table>
      </widget>
      <widget class_="checkbox" label_="Display Chart"
       value_="@display_chart"/>
      <widget class_="button" text_="Run" type_="submit"/>
      <ignore>
        <widget class_="text" text_="Current selection: {@selection}"/>
      </ignore>
    </layout>
    <layout width_="80%">
      <layout>
        <widget class_="grid" base_="{@sales_detail}"
         insert_="sales_by_date" prod_table="{@product_master}"
         department="{@selection}" group_by="{@aggregate_by}"
         invmsg_="Click Run for changes to take effect"
         holdfor_="@aggregate_by,@selection"
         clickable_="{@aggregate_by}" value_="@clicked_value"/>
        <widget class_="graphics" base_="{@sales_detail}" width_="800"
         insert_="sales_by_date" prod_table="{@product_master}"
         department="{@selection}" group_by="{@aggregate_by}"
         invmsg_="Click Run for changes to take effect"
         visible_="{@display_chart}" holdfor_="@aggregate_by,@selection">
          <graphspec>
            <chart type="bar">
              <data x="{@aggregate_by}" y="tot_sales"/>
              <ticks xrot="45"/>
              <style xaxissize="10" yaxissize="10"/>
            </chart>
          </graphspec>
        </widget>
      </layout>
      <layout>
        <widget class_="list" base_="{@product_master}"
         width_="500" maxheight_="600"
         require_="{@clicked_value <> ''}" invmode_="hide"
         label_="{@list_title}" value_="@list_selection">
          <if test="{@aggregate_by = 'brand_prod'}">
            <then>
              <sel value="(brand='{@clicked_value}')"/>
            </then>
            <else>
              <sel value="(groupdesc='{@clicked_value}')"/>
            </else>
          </if>
          <colord cols="sku,description"/>
          <sort col="description" dir="up"/>
        </widget>
        <widget class_="graphics" base_="{@sales_detail}"
         width_="800" height_="400" invmode_="hide"
         require_="{@list_selection <> ''}" >
          <if test="{@list_selection <> ''}">
            <sel value="between(trans_date;{@startdate};{@enddate})"/>
            <sel value="(sku={@list_selection})"/>
            <tabu label="Tabulation on Sales Detail"
             breaks="trans_date,sku">
              <tcol source="xsales" fun="sum" name="tot_sales_by_date"
               label="Sum of`Extended`Sales" format="type:currency"/>
            </tabu>
            <willbe name="date" value="trans_date" format="type:date4y"/>
            <graphspec>
              <chart type="line" title="{@item_title}">
                <axes xlabel="Date"/>
                <data x="date" y="tot_sales_by_date"/>
                <ticks xrot="45"/>
                <style xaxissize="10" yaxissize="10"/>
              </chart>
            </graphspec>
          </if>
        </widget>
      </layout>
    </layout>
  </layout>
</dynamic>


