Tabulation function examples
The following examples show how to implement various Python applications within Macro
Language code with the tabulation functions ten.dist_apply(),
ten.make_table(), and ten.get().
Example: Distributed matrix multiplication
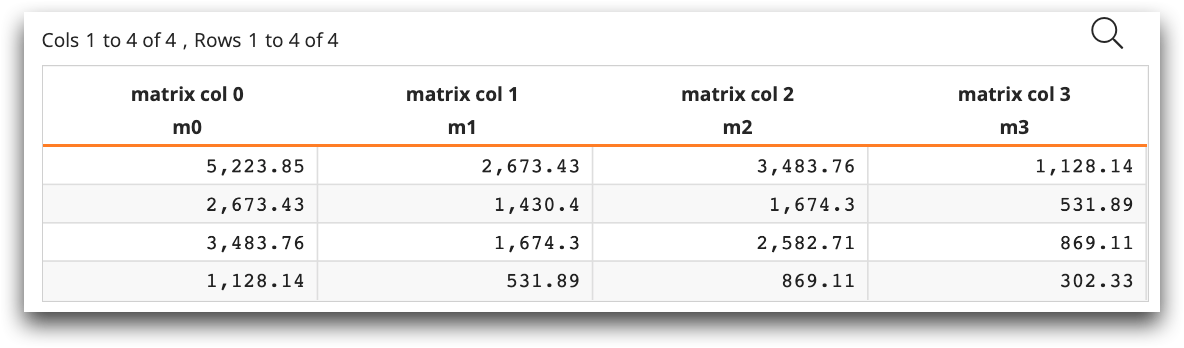
In the following example, ten.make_table contains the arguments
df (the pandas DataFrame) and a list of label names. The
function returns tabu, which can then be used by the accum to
create a worksheet.
<base table="mdb_regression_test_folder.iris"/>
<defop name="dist_matrix_mul" columns="">
  <tabu>
<code language_="python">
<![CDATA[
cols = '~{@columns}~'.split(',')
# user supplied function to distribute across segs
def subp_mat_mul_gram(x):
  mat = np.stack([ten.get(z) for z in x], axis = 1)
  return mat.T.dot(mat)
list_of_grams = ten.dist_apply(cols, subp_mat_mul_gram,  cols)
gram = np.sum(list_of_grams, axis = 0)
df = pd.DataFrame(gram, columns = ['m'+str(i) for i in range(gram.shape[1])])
tabu = ten.make_table(df, labels=['matrix col {}'.format(i).encode() for i in range(gram.shape[1])])
]]>
    </code>
  </tabu>
</defop>
<dist_matrix_mul columns="sepal_length,sepal_width,petal_length,petal_width"/>
The resulting tabulation looks like the following: