Visualize data
You can use Tableau visualizations to display insights that have been discovered in the data.
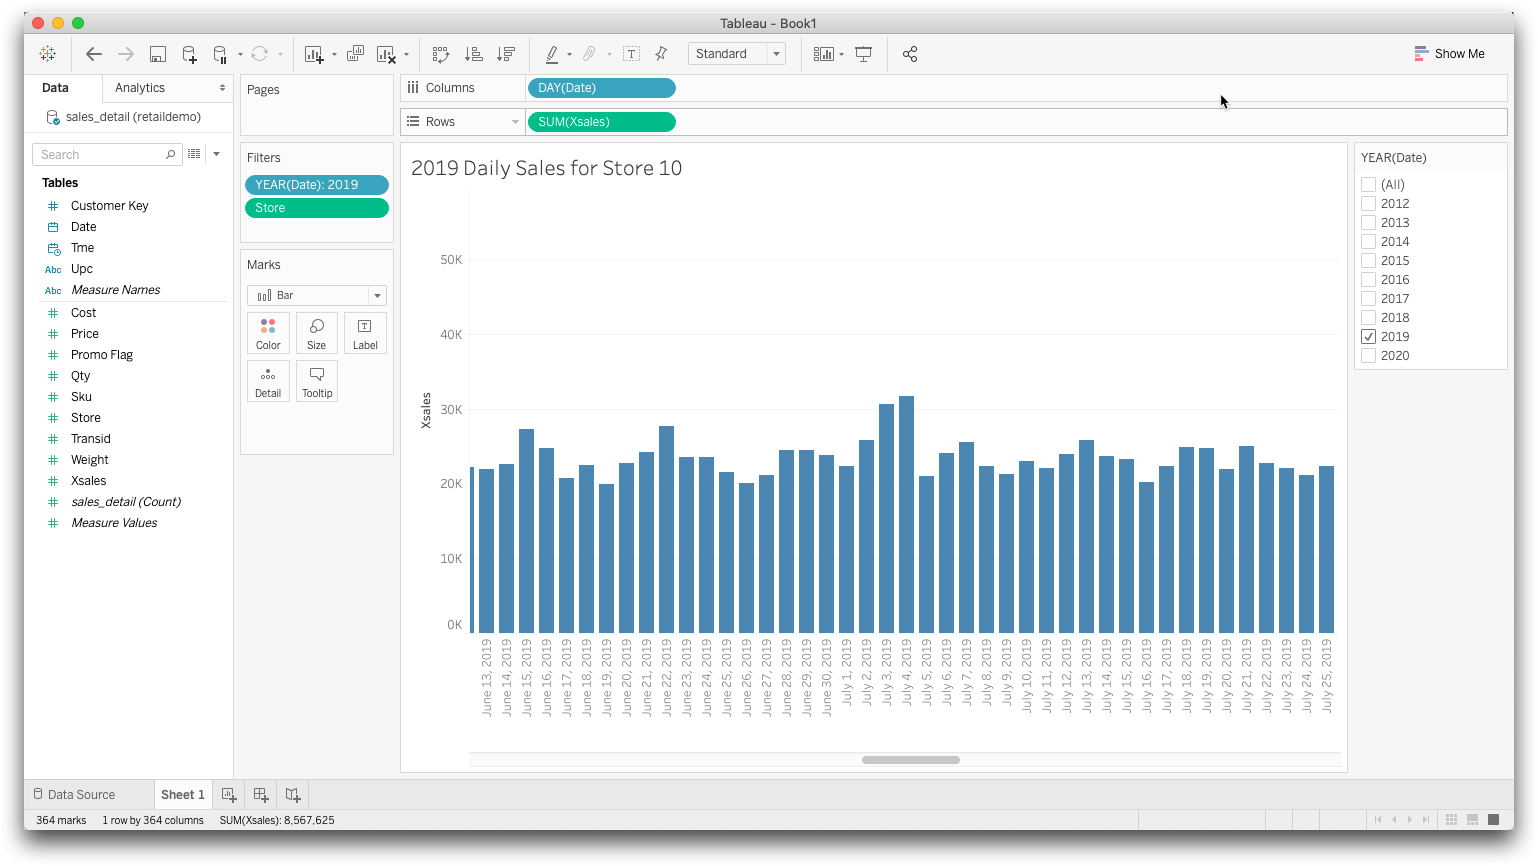
The following example shows how to create a simple bar graph showing total sales by day for a single store for the year 2019.
To create a simple data visualization:
-
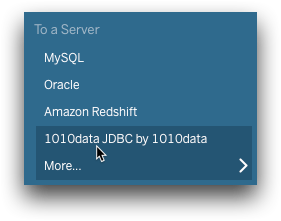
Connect to 1010data from Tableau.
If you have already connected to 1010data, select it from the To a Server list.
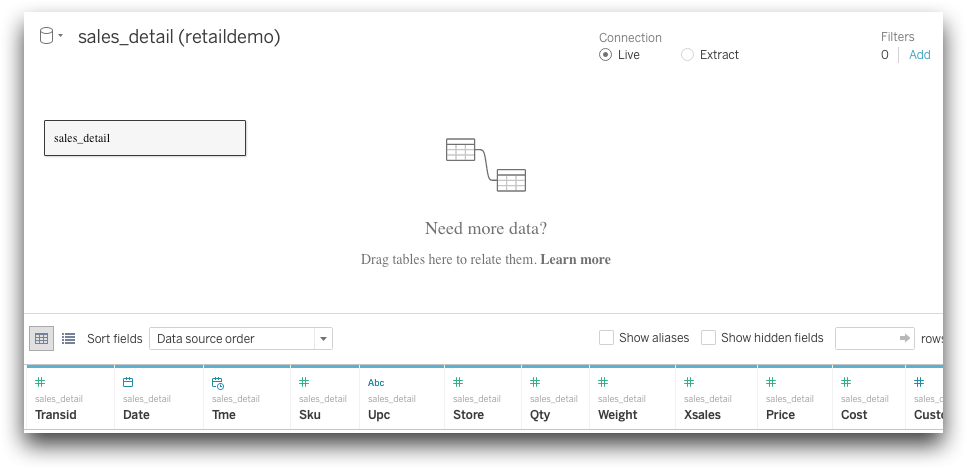
 If your connection is successful, you will see your connection in the Data Source tab of the Tableau screen.
 - From the Database drop-down list, select tenten.
- From the Schema drop-down list, select retaildemo.
-
Drag sales_detail to Drag tables
here.
- Click the Sheet 1 tab at the bottom left of the window to begin your visualization.
-
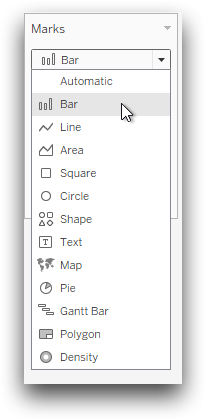
Find the Marks card (between the Data
pane and the sheet display area). Select Bar from the
drop-down list.
-
Select Date from the Dimensions
section in the Data pane. Drag Date to
the Filters shelf.
A Filter Field [Date] dialog appears.
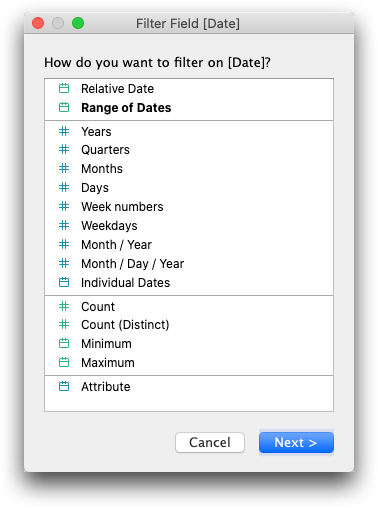
- Select the Years filter.
-
Click Next.
The Filter [Year of Date] dialog appears.
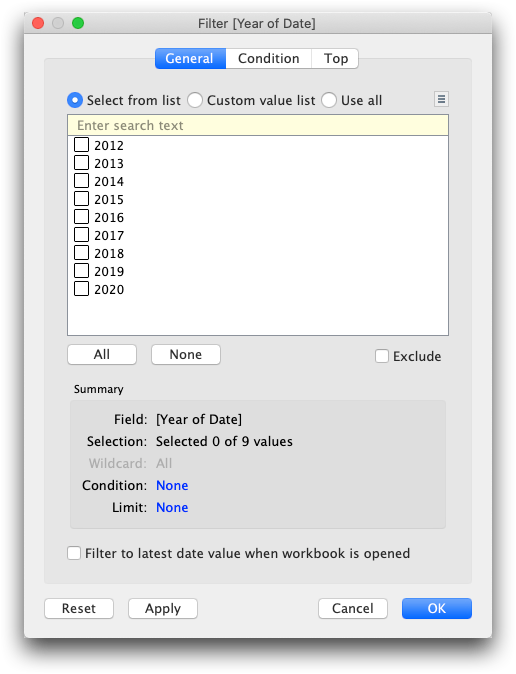
- Select 2019.
- Click OK.
- Select Store from the Measures section of the Data pane. Drag Store to the Filters shelf.
-
With Store, repeat the filtering steps you performed for
Date, choosing Store 10.
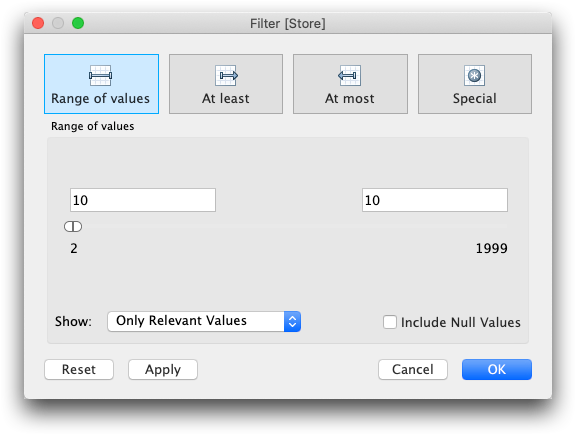
- Click OK.
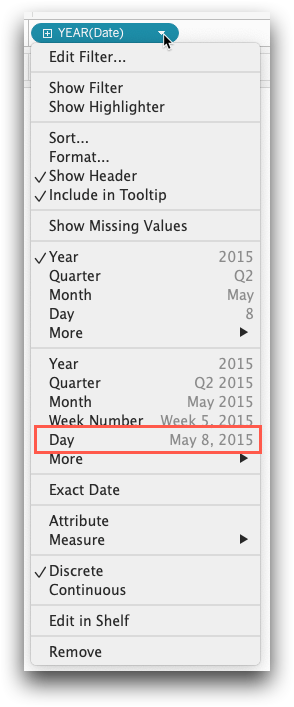
- Drag the Date column to the Columns area.
-
Click the down arrow to the right of the date. Select Day
from the drop-down list.
-
Drag the Xsales column to the Rows
area.
Tableau automatically provides the sum of sales in the Rows area.
-
Change the chart formatting as desired.