
Returning values based on location
G_functions can return a selection of data based on the location of a specified value,
similar to using MATCH and OFFSET in Excel.
Difficulty
Objective
You have a data table and you would like to return a collection of values surrounding a
specific data point. For example, you have a record of daily snowfall and would like to know
the entries for the week prior and the week after the largest recorded snowfall. You know
how to do this in Excel by using the MAX, MATCH, and
OFFSET functions, and you would like to know how to perform the same
operations using 1010data.
Excel solution
The OFFSET function returns a cell or number of cells surrounding a
specified position. To obtain all of the arguments for OFFSET,
MATCH is used in combination with MAX to find the
position of the cell that contains the highest snowfall for the recorded data. Then the
following array formula is used to find the information for the surrounding days.
=OFFSET(D1,MATCH(MAX(D:D),D:D,0)-4,-2,7,3)Your Excel worksheet should look similar to the image below.
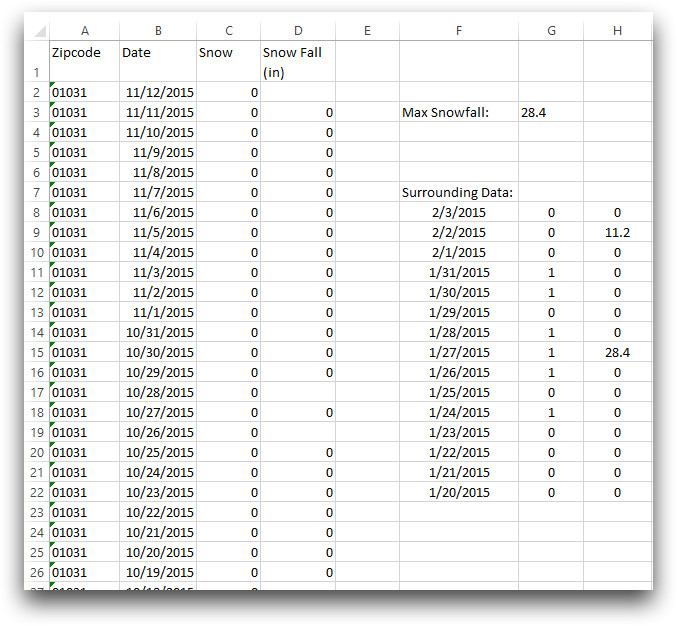
Because the formula is an array formula, you need to select multiple cells in which to enter the formula in, because a single cell can only display one value. This can be difficult when selecting large amounts of data. Using 1010data, a single command can select data of varying size.
1010data Macro Language solution
<base table="pub.demo.weather.wunderground.observed_daily"/>
<sel value="zipcode=01031"/>
<willbe name="test" value="g_hi(zipcode;;snowfalli)"/>
<sel value="between(i_;g_position(zipcode;;;snowfalli;test)-7;
g_position(zipcode;;;snowfalli;test)+7)"/>
<colord cols="zipcode,date,snow,snowfalli"/>
In order to select the data that surrounds the data point with highest snowfall, you first
need to find the highest snowfall value, using g_hi(G;S;X), and populate a
computed column with that value. This computed column is needed because the function
g_position(G;S;O;X;Y) compares values in specified columns to find the
row containing that value.
i_ is a system variable that denotes a specific row in the
table. Using the function between(X;Y;Z) you can select rows that are
contained within a range based on the row position of the max snowfall, plus or minus seven
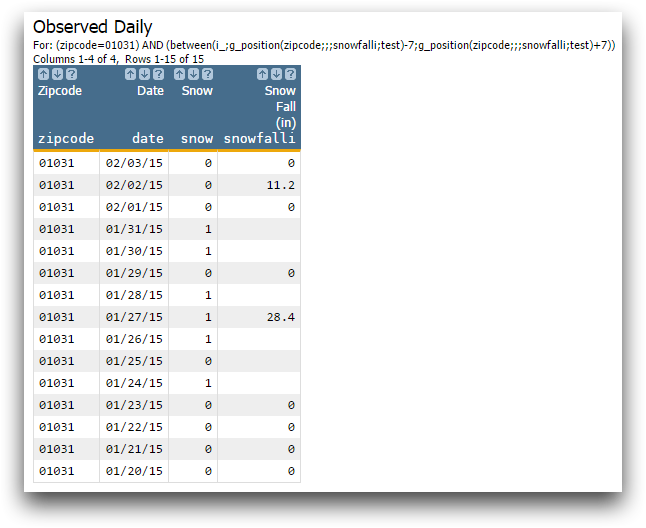
rows. This combination of operations produces the worksheet seen below.
Further reading
If you would like to learn more about the functions and operations discussed in this recipe, click on the links below: