
Finding corresponding data in different tables
You can use a link and select to find information on a specified value contained in a
separate table. This operation is similar to using LOOKUP and
VLOOKUP to find corresponding information in a different
worksheet.
Difficulty

Objective
You have a table containing the sum of sales for every department in each store. You would
like to determine the store with the highest total sales and then find the city in which
that store is located. However, information about each store is contained in a separate
table. This can be done in Excel by using the MAX, LOOKUP,
and VLOOKUP functions, but you would like to know how to perform the same
operations in 1010data.
Excel solution
The table containing the summary of sales is created by using a pivot table, as can be seen
in the Creating a Simple Pivot Table
analogue. To find the store that had the highest sum of sales from this table, you first use
the MAX function to determine which sum is the highest.
=MAX(Q5:Q22)The LOOKUP function then uses the results of the MAX
function to find the store number that is associated with the highest sales.
=LOOKUP(C18,Q5:Q22,A5:A22)VLOOKUP uses the resultant store number to find the name of the city where
the store is based, from the table located in a separate worksheet.
=VLOOKUP(C19,Sheet1!A1:O11,10,FALSE)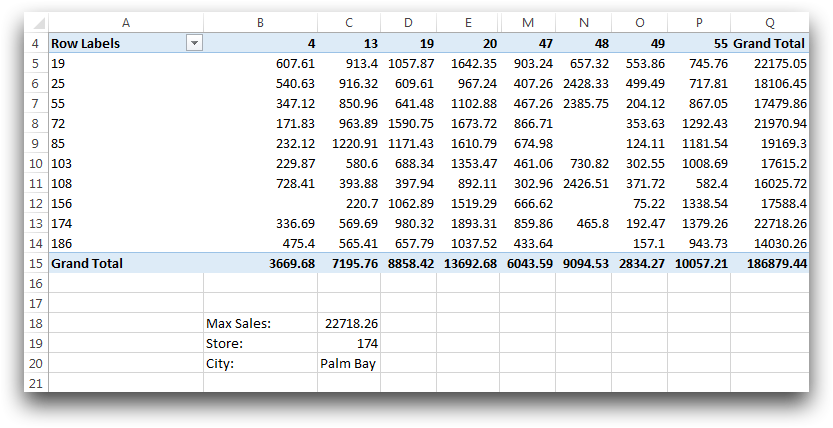
Three functions is all it takes to find the location of the store with the highest sales,
however there are some drawbacks to these functions. In order to use the
LOOKUP function you must have your table sorted in ascending order in
relation to total sales and your look-up column must be the last in your table. Contrary to
LOOKUP, the look-up column for VLOOKUP must be the first
in the table. If 1010data is used to find the store information, these sorting constraints
are not an issue.
1010data GUI solution
Once the Sum of Sales tables is complete (see the analogue, Creating a Simple Pivot Table), click to open the following dialog.
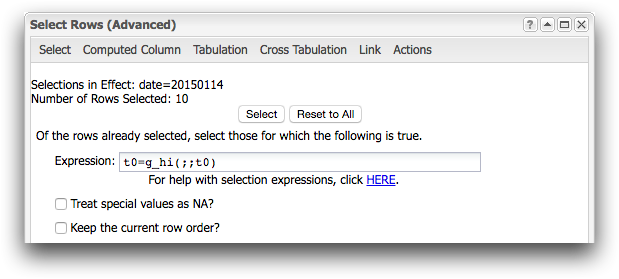
To find the store with the highest total sales, you need to enter g_hi(;;t0), in the Expression field. Then from the same dialog; clicking on Link opens the dialog below.
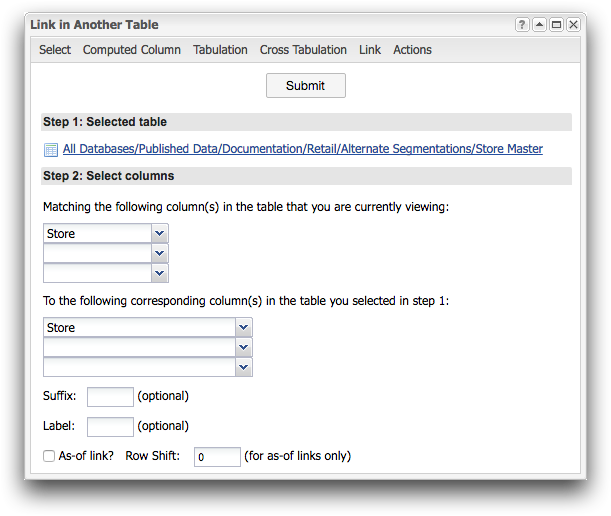
After selecting the desired table, in this case, Store Master, you again use the drop-down menus and select the columns on which to link. These columns will be used to combine the two tables on a common data point. Since the previous selection left the table with only one row, when the Store Master table is linked, only the information about the top selling store is selected.
1010data Macro Language solution
The same results can be found by entering the following macro code into the Edit Actions dialog.
<base table="pub.doc.retail.altseg.sales_detail_transid"/>
<sel value="trans_date=20150114"/>
<tabu label="Sum of Sales Per Department and Store"
 breaks="store" cbreaks="dept" clabels="short">
  <break col="store" sort="up"/>
  <break col="dept" sort="up"/>
  <tcol source="xsales" fun="sum"/>
</tabu>
<sel value="t0=g_hi(;;t0)"/>
<colord cols="store,t0"/>
<link table2="pub.doc.retail.altseg.stores" col="store" col2="store"/>
The first part of the code creates a pivot-like table that can be found in the Creating a Simple Pivot Table
analogue. The selection statement is used to find the highest value in the column
t0, which is a computed column that contains the total sales,
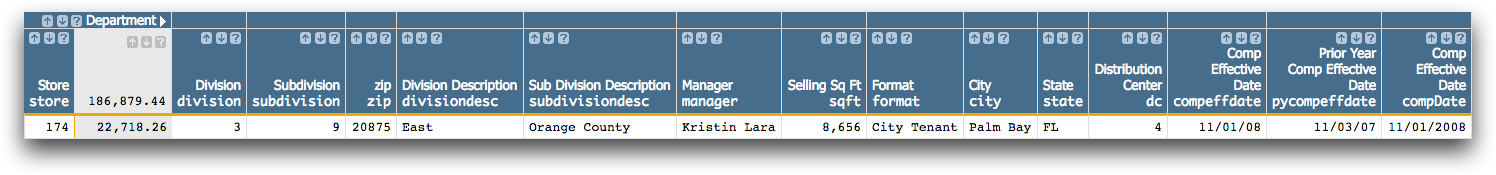
and select only the row containing that value. By using the <link>
operation we are able to bring in the information pertaining to the selected store from the
Store Master table.
Further reading
If you would like to learn more about the functions and operations discussed in this recipe, click on the links below: