
Calculating the maximum and minimum values
A single tabulation in 1010data can calculate the maximum and minimum values of a table.
Difficulty
Objective
You have a table consisting of daily weather observations and you would like to find the
maximum and minimum temperatures for a specific zipcode. You know how to do this in Excel
using the MAX and MIN functions, and you would like to
produce the same results using 1010data.
Excel solution
With Excel's MAX and MIN functions, you can enter a range
of numbers and the functions will output which number in the range is the highest and lowest
respectively. These functions can be seen in the equations below.
=MAX(F:F)=MIN(F:F)Although Excel has no problem finding the maximum and minimum values for this table, a larger table could produce issues. Excel is limited in the size of data tables it can process, and there also might be longer processing times with larger tables. 1010data can calculate the same results on larger tables and at faster speeds.
1010data GUI solution
After selecting the desired zipcode, for this example, 01001, you can create computed columns that contain the maximum and minimum temperature values.
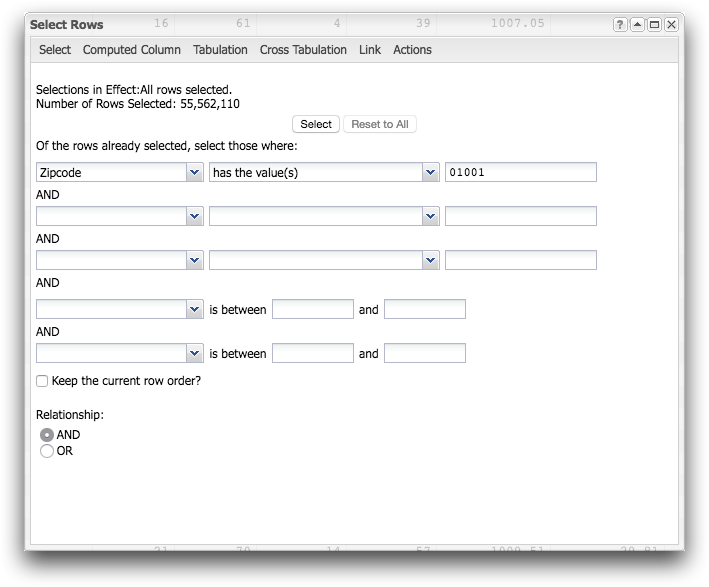
Within the 1010data menu, click to open the following dialog.

Within the Value Expression field, you can use the g_hi(G;S;X) and
g_lo(G;S;X) to find the max and min temperatures respectively.
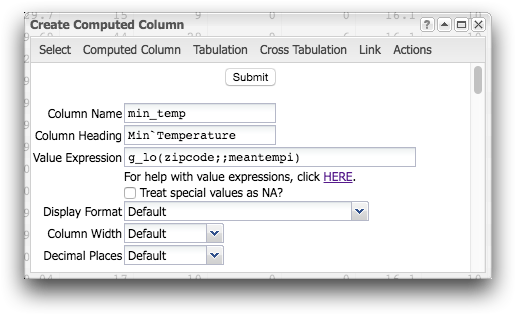
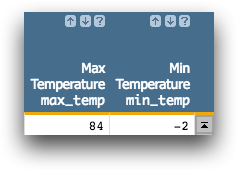
Two columns will be added to your table, with each row populated by the max and min temperature.
Alternate 1010data GUI solution
After selecting the desired zipcode, for this example, 01001, you can use 1010data's GUI to perform a tabulation and find the maximum and minimum temperature values.
Within the 1010data menu, click to open the following dialog.
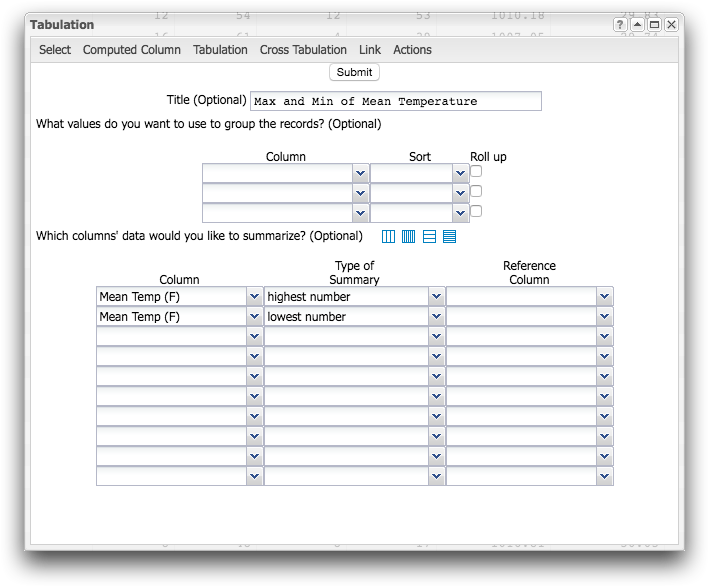
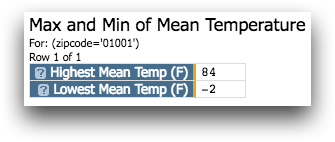
Using the drop-down menus, you can calculate two summaries on the Mean Temp (F) column, one for the highest number and one for the lowest number in the column. Selecting these options will create the results shown in the image below.
1010data Macro Language solution
<base table="pub.demo.weather.wunderground.observed_daily"/>
<sel value="zipcode='01001'"/>
<willbe name="max_temp" value="g_hi(zipcode;;meantempi)"
label="Max`Temperature"/>
<willbe name="min_temp" value="g_lo(zipcode;;meantempi)"
label="Min`Temperature"/>
When able to, using g_functions is most often the preferred solution. They take advantage
of the table's segmentation and therefore are more efficient than tabulations.
g_hi(G;S;X) and g_lo(G;S;X) will find the highest and
lowest temperatures in each group. Since there is only one zipcode in the current worksheet,
there is only one group, and these functions will just return the values for zipcode
01001.
Alternate 1010data Macro Language solution
The following macro code will produce the same results as using 1010data's GUI in the alternate solution and can be entered in the Edit Actions dialog.
<base table="pub.demo.weather.wunderground.observed_daily"/>
<sel value="zipcode='01001'"/>
<tabu label="Max and Min of Mean Temperature">
  <tcol source="meantempi" fun="hi" label="Highest`Mean`Temp`(F)"/>
  <tcol source="meantempi" fun="lo" label="Lowest`Mean`Temp`(F)"/>
</tabu>
Further reading
If you would like to learn more about the functions and operations discussed in this recipe, click on the links below: