
Create a computed column from a cross-tabulated column
Once you have a completed cross tabulation, you can work with the resultant columns of the new worksheet the same as you would with any other 1010data table. This makes it easy to create new metrics based on your summaries.
In this tutorial, you will perform a simple day-over-day calculation by first creating a cross tabulation and then creating a computed column.
In your analysis, you want to see the sales of one date compared to the sales of a different date for all three of your fictional stores. For this example, the dates are consecutive.
To create a computed column from a cross-tabulated column:
-
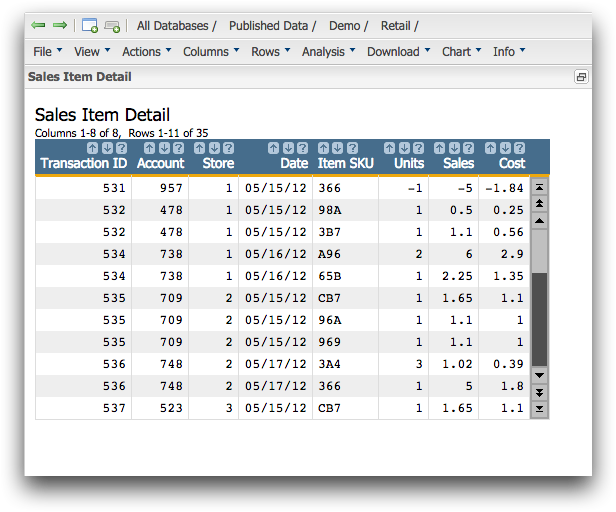
Open the Sales Item Detail table
(pub.demo.retail.item).
1010data displays the Sales Item Detail table.
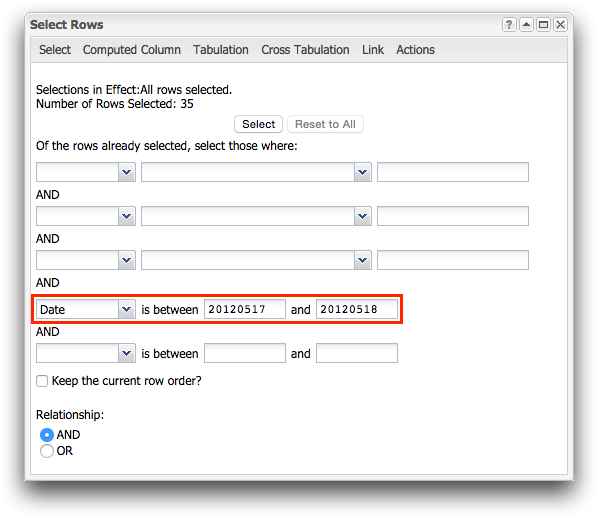
Next, perform a row selection to get the two days in which you are interested.
-
From the drop-down list preceding the first is between
label, select Date. In the next field, enter
20120517, and in the last field, enter
20120518.
-
Click Select.
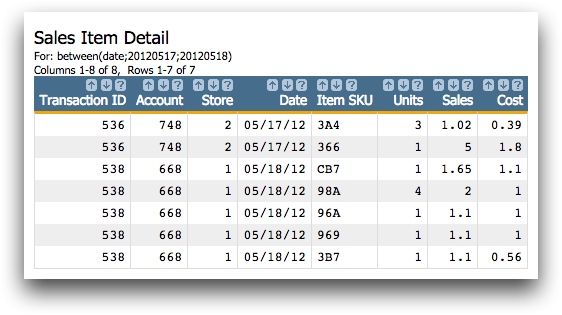
1010data displays the results of your selection.
Next, you will create your cross tabulation. This will give you the totals for both the stores overall, and the totals for each of the two dates you selected.
-
Click .
1010data displays the Cross Tabulation dialog.
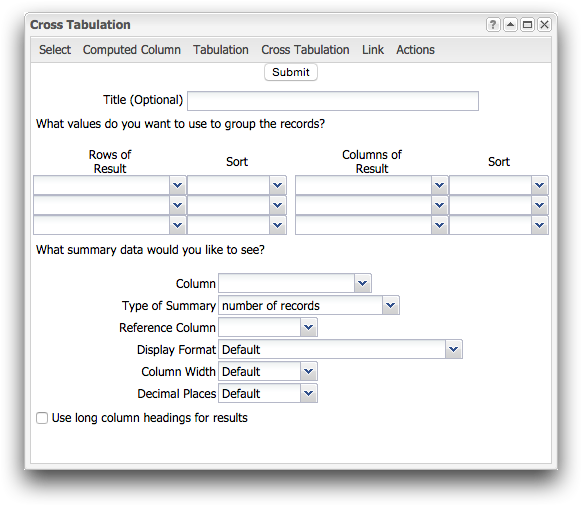
Next, you need to select the summary type. The summary applies to both the row grouping and the column grouping. In this case, we are calculating total sales by date for each store.
-
Under the Which summary data would you like to see?
section, complete the following:
Column Select Sales. This selection chooses the column of data you want to act on. In this instance, you want to calculate the total sales.
Type of Summary Select Sum. This selection chooses the action you want to perform on the selected column. In this case, you want to summarize the data in the sales column.
Reference Column Leave this field blank. Display Format Select Currency: $1,234.56. Column Width Select Default. Decimal Places Select Default. 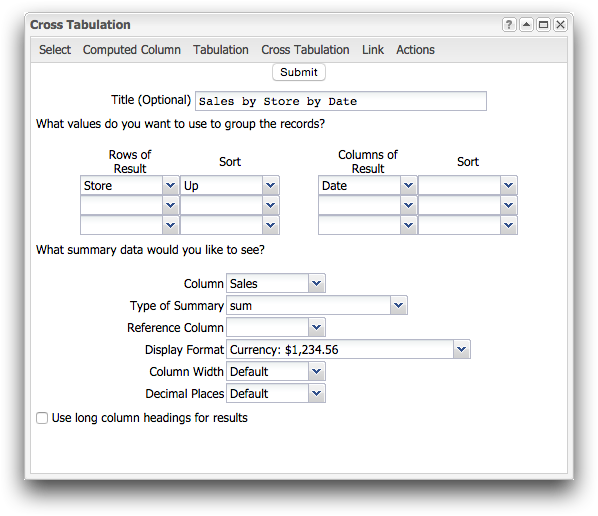
Here, your horizontal (row) summary is grouped by store, and the vertical (column) summary is grouped by date.
-
Click Submit.
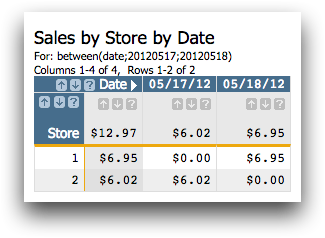
1010data displays the results of your cross tabulation.
Since you eliminated all the dates except the two you are interested in, you can now create a computed column that shows the difference in sales from one day to the next.
-
Click .
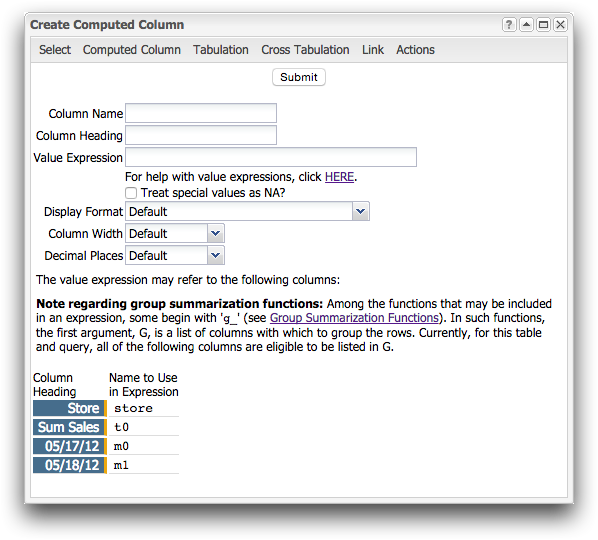
1010data displays the Create Computed Column dialog.
-
Complete the following fields in the Create Computed
Column dialog.
Column Name Enter dod. Column Heading Enter Day-Over-Day. Value Expression Enter m1-m0. Note: By default, resultant columns in cross tabulations are namedm0,m1, etc.In this case, to calculate the day-over-day sales, simply subtract the values in the column with the less recent date (
m0) from the values in the column with the more recent date (m1).Display Format Select Currency: $1,234.56. Column Width Select Default. Decimal Places Select Default. 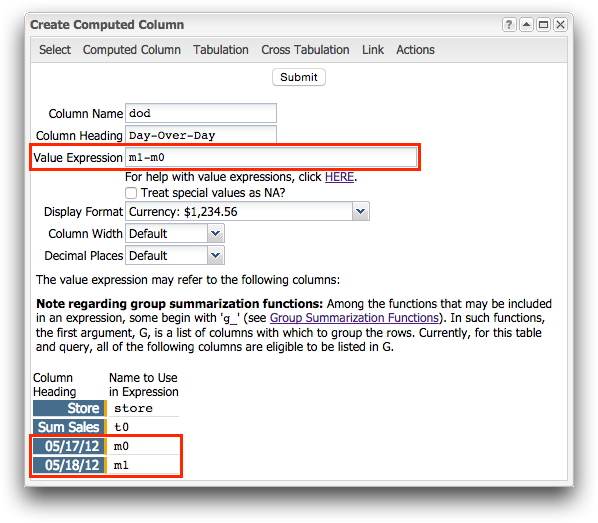
-
Click Submit.
1010data creates the Day-Over-Day computed column.
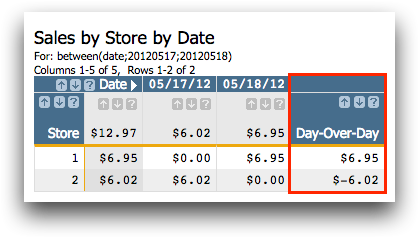
From the results, it is clear that the sales for store 2 plummeted on the last day.