
Perform a cross tabulation
A cross tabulation provides extra granularity from a summary without losing the highest level of data summarization.
In this tutorial, you will learn how to perform a cross tabulation to determine the sales amount by store. The sales totals for each store will be broken out by department so you can see how much each department contributed to the total sales.
To perform a cross tabulation:
-
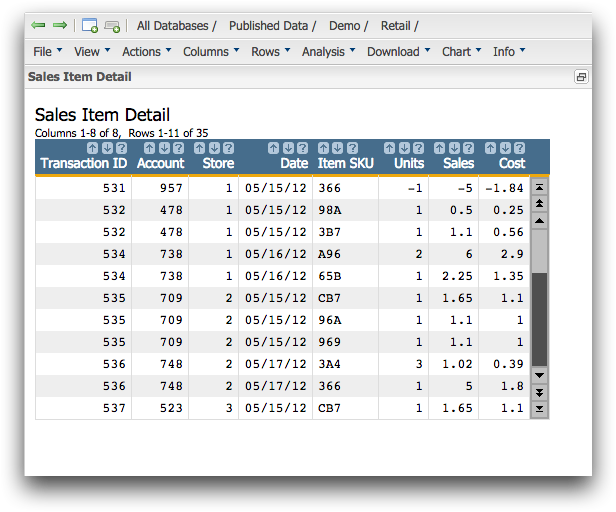
Open the Sales Item Detail table
(pub.demo.retail.item).
1010data displays the Sales Item Detail table.
To get the department information for your cross tabulation, you need to link in the Product Master table. This is identical to the process used in Link in a table.
-
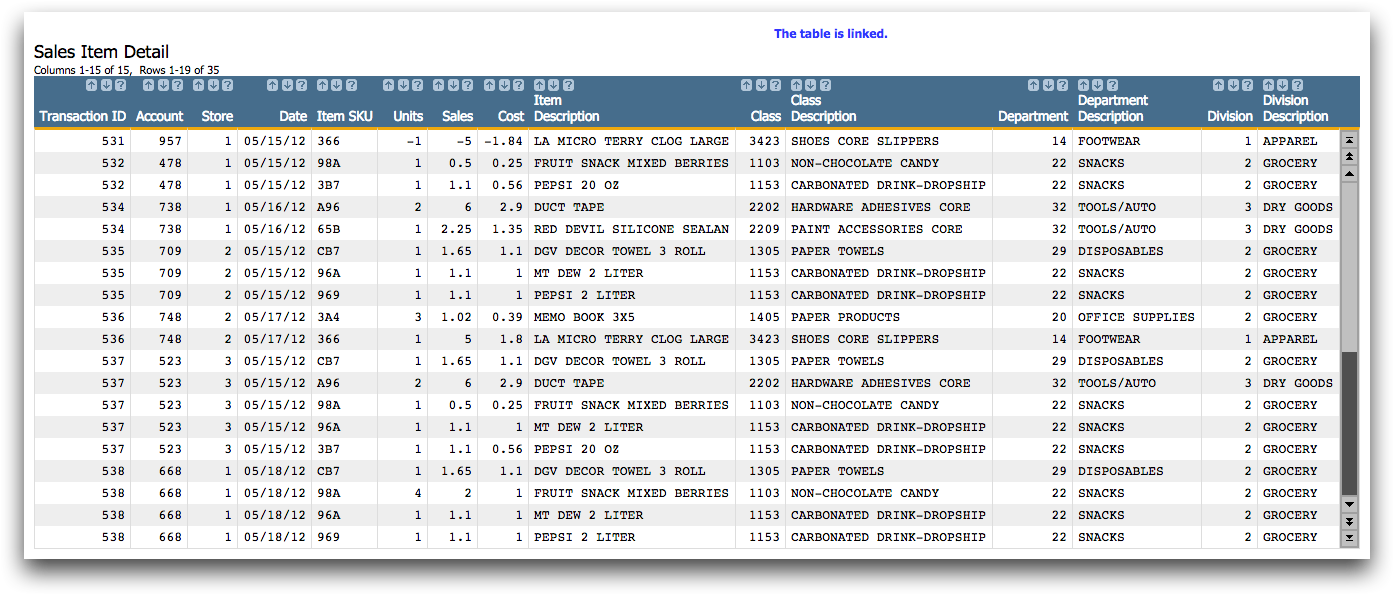
Click Submit.
1010data links the Product Master table into the Sales Item Detail table and displays the results of the link.
-
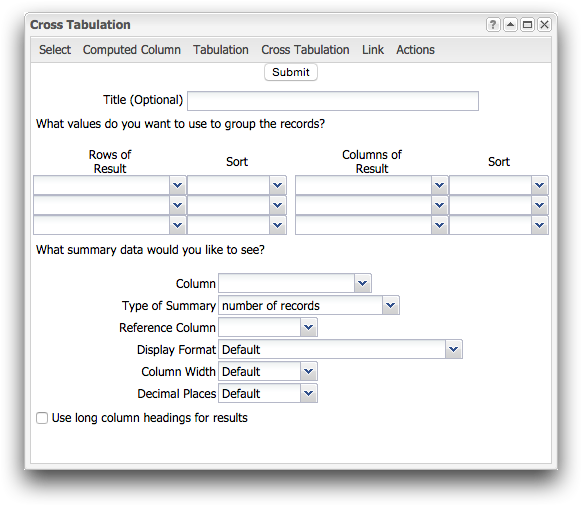
Click .
1010data displays the Cross Tabulation dialog.
Next, you need to select the actual summary type. The summary applies to both the row grouping and the column grouping. In this case, we are calculating total sales by department for each store.
-
Under the Which summary data would you like to see?
section, complete the following:
Column Select Sales. This selection chooses the column of data you want to act on. In this instance, you want to calculate the total sales.
Type of Summary Select Sum. This selection chooses the action you want to perform on the selected column. In this case, you want to summarize the data in the sales column.
Reference Column Leave this field blank. Display Format Select Currency: $1,234.56. Column Width Select Default. Decimal Places Select Default. 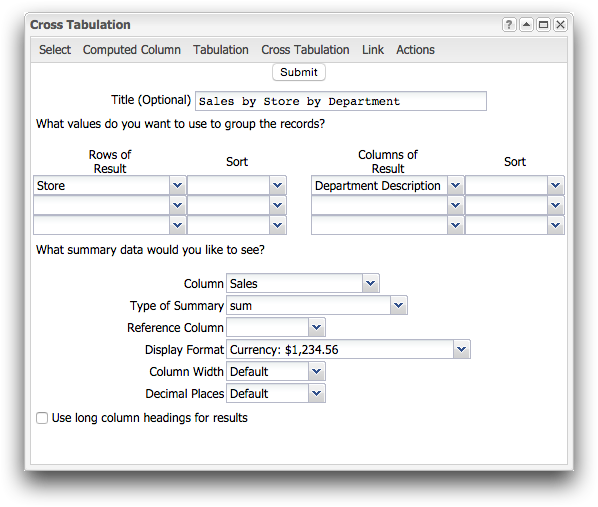
-
Click Submit.
1010data displays the results of your cross tabulation.
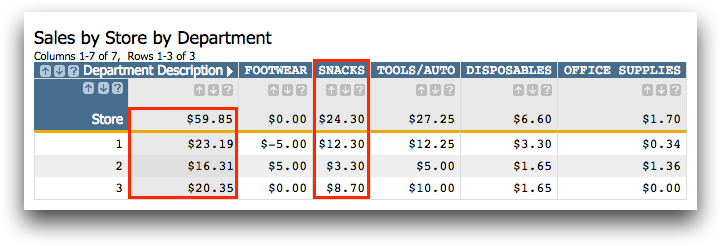
As you can see above, the totals for all the stores are still available in the first column outlined in red. However, you can also see how much each department contributed to those totals. For instance, the Snacks department accounted for $24.30 of the $59.85 in total sales across all the stores in our fictional retail chain.
Further granularity shows that in store 1, $12.30 was from the Snacks department.