
Add 1010data Macro Language to a query
In the course of creating visualizations for your data in Power BI, you may need to use specific 1010data operations.
You can add 1010data operations to your Power BI query by using the 1010data
MACRO() function within a SQL statement. You add the SQL
statement under Advanced Options in the
1010data connection dialog.
- In Power BI, connect to the 1010data source as described in Connect to 1010data from Power BI.
-
In the 1010data connection dialog, under
Advanced Options, enter a SQL statement.
Note: You must choose Import mode.
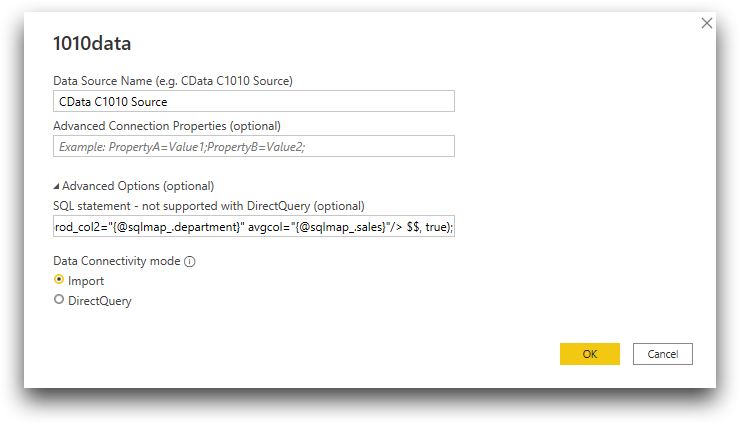 The example SQL statement is as follows:
SELECT * FROM MACRO(
   (SELECT "Trans ID" AS transid,
           "Department Desc" AS department,
           "Extended Sales" AS sales
     FROM "retaildemo.retail.sales_detail"
     JOIN "retaildemo.retail.products" USING ("SKU")
     WHERE "Date" BETWEEN DATE '1/1/2018' AND DATE '1/31/2018'),
   $$
   <retail:basket_affinity basket_id="{@sqlmap_.transid}"
     prod_col1="{@sqlmap_.department}" prod_col2="{@sqlmap_.department}"
     avgcol="{@sqlmap_.sales}"/>
   $$,
   true);
This SQL statement performs the 1010data operation<retail:basket_affinity>on the results of a SQL query.<retail:basket_affinity>analyzes the affinity between two different departments. TheMACRO()function is necessary for combining SQL queries and 1010data Macro Language operations. SeeMACRO()in the 1010data Reference Manual for more information. -
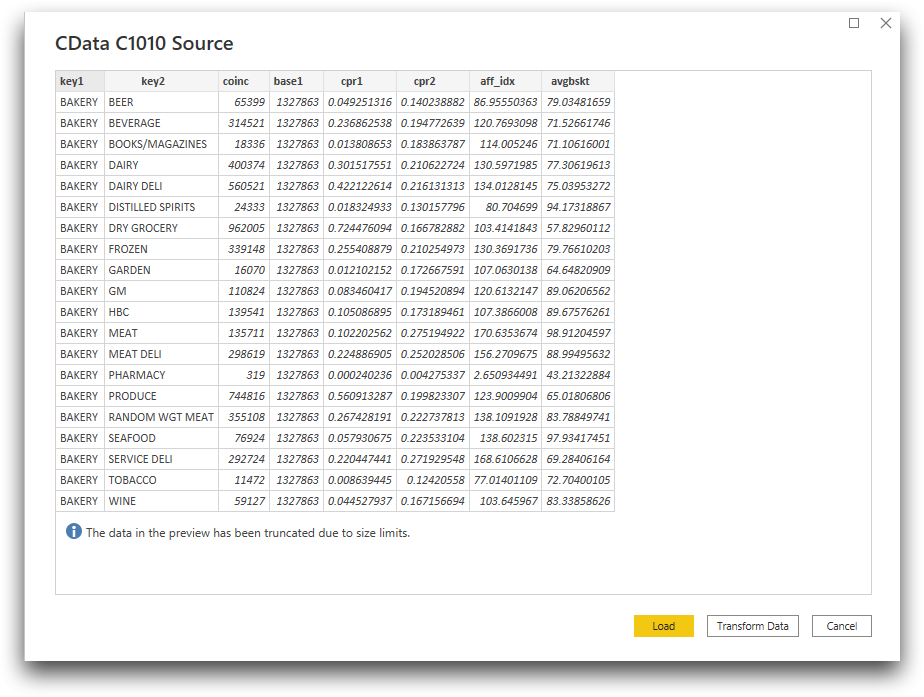
Click OK.
A preview of your query results appears.
-
Click Load to work with the data to build
visualizations, or Transform Data to view the query in
the Power Query Editor.
This is what the example SQL query looks like in the Power Query Advanced Editor.
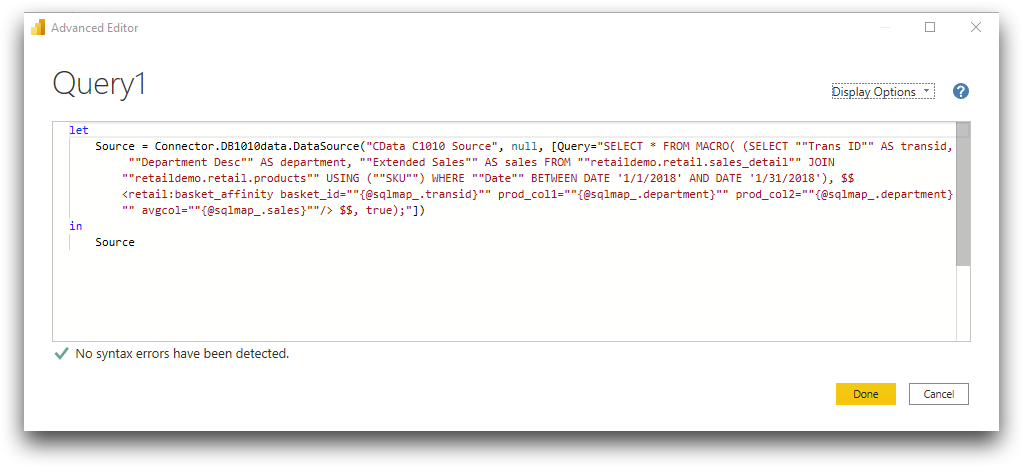
- If necessary, edit your SQL query in the Advanced Editor.
-
Optional: If you edit the query, you must apply the changes.
Note: In Import mode, unlike Direct Query mode, the updates to the data do not occur automatically.
- Create visualizations with the results of your query.