ten.GetData(ops,table,rows,cols)
Return a GetData object.
Syntax
ten.GetData(ops=None,table=None,rows=None,cols=None)Arguments
ops- A list representing the set of ops in effect up to the current
<code>. The default value is None. table- A utf-8 string representing the base path. The default value is None.
rows- A list, range, iterator, or NumPy array, with numeric values. The default value is None, which returns all rows.
cols- A list of unicode column names (not labels). The default value is None, which returns all columns.
Methods
GetData.from_path(table,rows=None,cols=None)- Modifies a
tablevariable ofGetData. GetData.from_ops(ops,rows=None,cols=None)- Modifies an
opsvariable ofGetData. GetData.as_pandas(name_type)- Returns a pandas
DataFrameforname_typeof'names'or'labels'. GetData.as_arrays()- Returns a list of NumPy arrays, such as
[np.array([1,2,3],dtype=np.int32),np.array(['a','b','c'])]. GetData.pandas_from_arrays(arrays,names)- Returns a pandas
DataFrameforarrays(a list of NumPy arrays) andnames(a list of unicode strings).This is a helper function to convert arrays to pandas.
Returns
A GetData object, which contains the variables ops,
table, rows, and cols.
Example
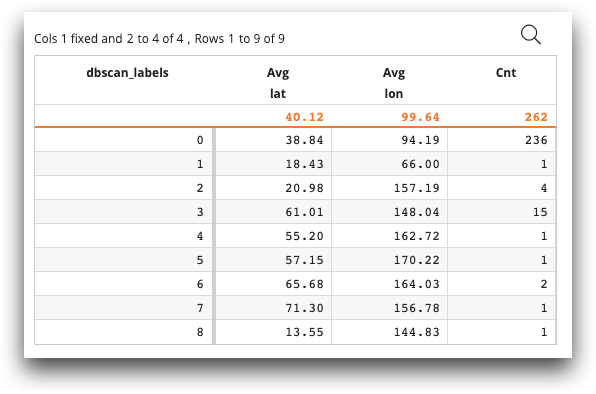
The following example retrieves latitude and longitude data from
demos.stations. The Python code makes use of
DBSCAN, a density-based clustering algorithm that is imported.
The Python code performs the density algorithm to determine the density of the
weather stations. ops, which now includes the
dbscan_labels data, now represents the current state of the
query. After ops is returned, <tabu> performs a
tabulation of the weather stations, grouped by weather station density. The
tabulation includes the average latitude and average longitude at each density
level, as well as the count of weather stations at each density level.
<base table="demos.stations"/>
<code language_="python">
<![CDATA[
from sklearn.cluster import DBSCAN
from ten import GetData as gd
df = gd(ops,table, cols=['lat','lon']).as_pandas()
coords = df.to_numpy()
kms_per_radian = 6371.0088
epsilon = 450 / kms_per_radian
db = DBSCAN(eps=epsilon, min_samples=1, algorithm='ball_tree', metric='haversine').fit(np.radians(coords))
df['dbscan_labels'] = db.labels_
ops = ten.rebase(df)
]]>
</code>
<tabu breaks="dbscan_labels">
    <tcol name="avg_lat" source="lat" fun="avg"/>
    <tcol name="avg_lon" source="lon" fun="avg"/>
    <tcol name="label_cnts" source="dbscan_labels" fun="cnt"/>
</tabu>