
Access a particular value in a table
There are times when you might want to get the value of a specific cell in a table and save it in a dynamic variable.
For instance, you might want to add a title to the line chart that was created in
Specify conditions for widget validation which shows the item description
that was selected in the list widget. However, since the value of the
list_selection dynamic variable is the SKU and not the item description,
you need to look up that SKU in the Product Master table to get the
associated item description. Once you find the value in the table, you can save it to a
dynamic variable in a <do> clause. The specific cell can be specified
using the row_ and col_ attributes in the
<do> tag, and the dynamic variable can be specified using the
value_ attribute.
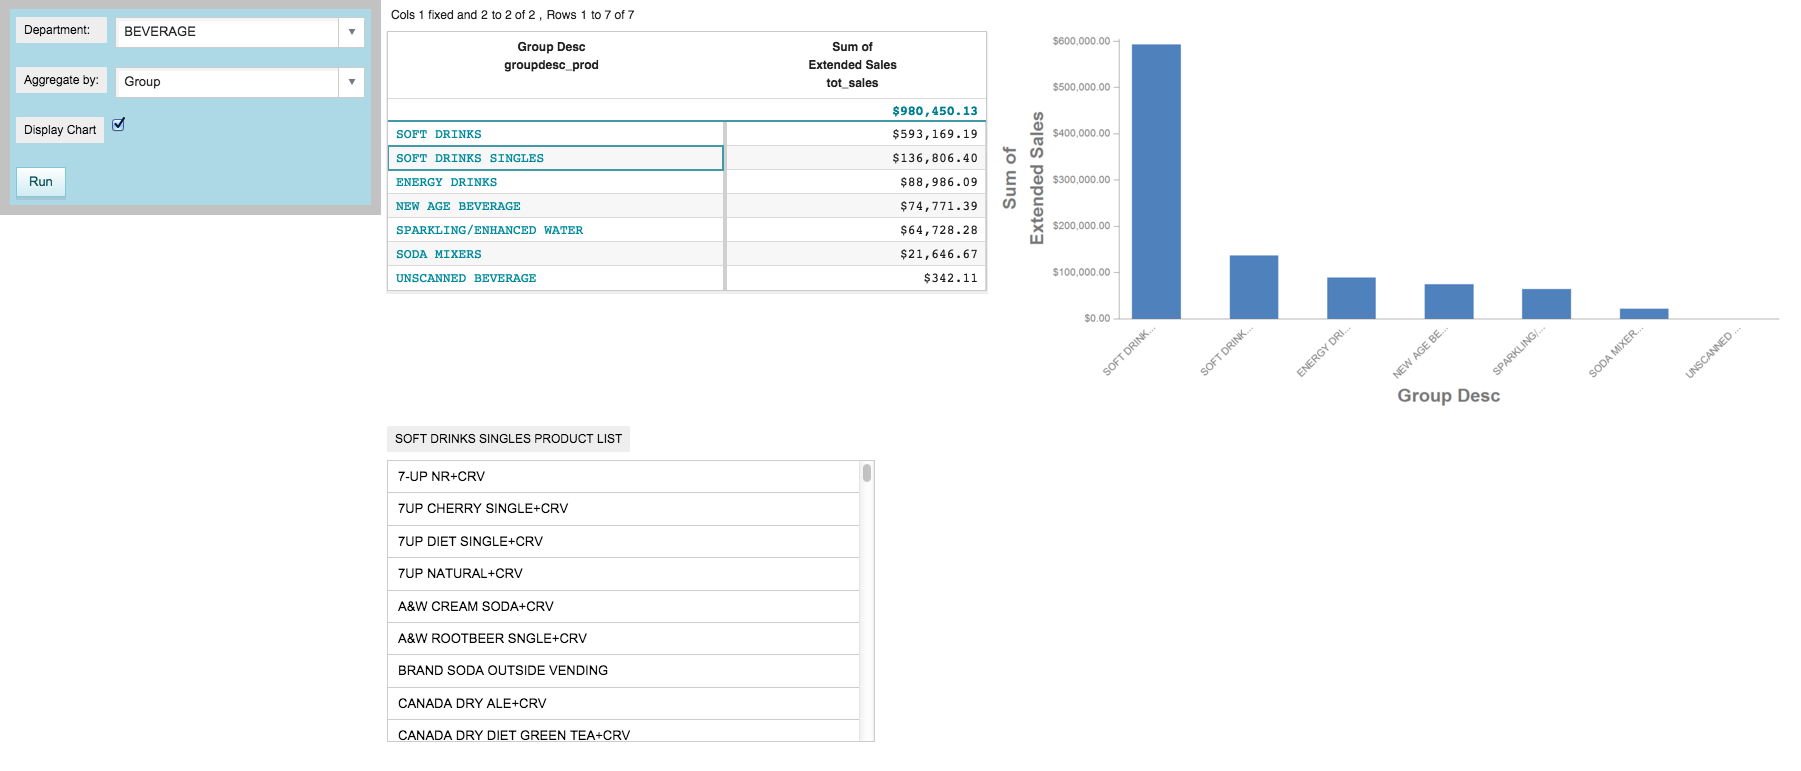
To access a particular value in a table:
-
Click an item in the grid widget (e.g., SOFT DRINKS
SINGLES).
The list widget is displayed.
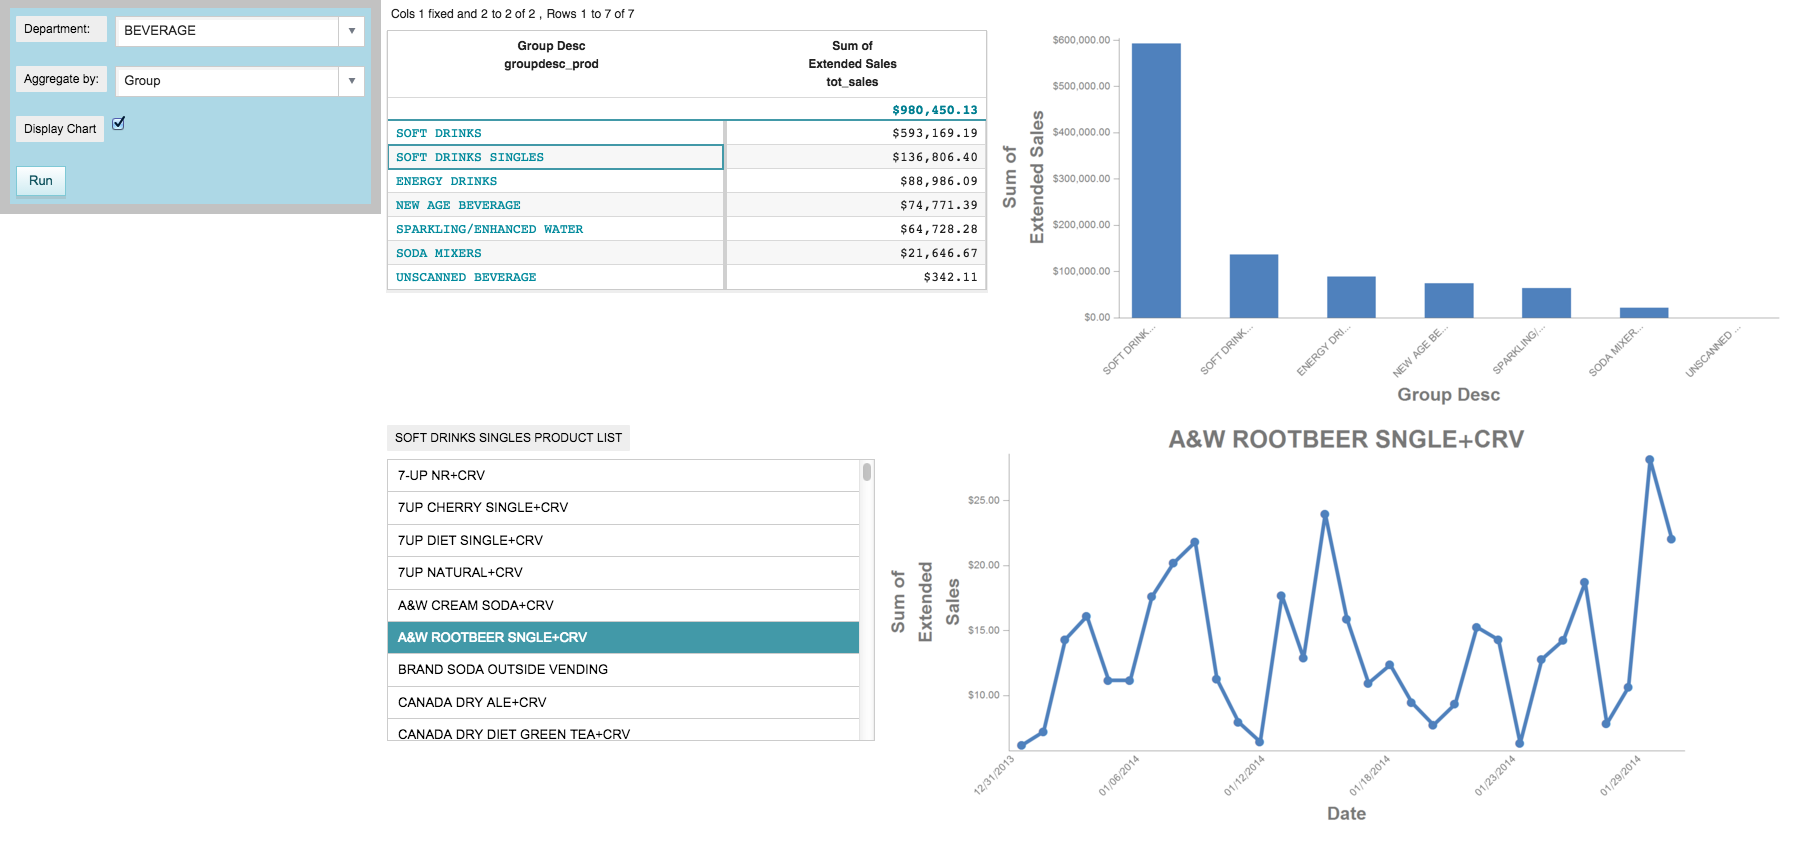
-
Click an item in the list widget (e.g., A&W ROOTBEER
SNGLE+CRV).
The graphics widget containing the line chart now appears with the title above it.
Cumulative QuickApp code
The Macro Language code for the QuickApp up to this point is:
<defblock name="sales_by_date" prod_table="" department="" group_by="">
  <link table2="{@prod_table}" col="sku" col2="sku"
   suffix="_prod" type="select">
    <sel value="dept={@department}"/>
  </link>
  <tabu label="Tabulation on Sales Detail" breaks="{@group_by}">
    <tcol source="xsales" fun="sum" name="tot_sales"
     label="Sum of`Extended Sales" format="type:currency"/>
  </tabu>
  <sort col="tot_sales" dir="down"/>
  <sel value="({@group_by} <> '')"/>
</defblock>
<dynamic selection="19" product_master="pub.doc.retail.product"
 sales_detail="pub.doc.retail.salesdetail" aggregate_by="groupdesc_prod"
 mode_="auto" display_chart="1" clicked_value="" list_title="PRODUCT LIST"
 list_selection="" startdate="20140101" enddate="20140131"
 item_title="SALES OVER TIME">
  <do onchange_="@aggregate_by,@selection">
    <set clicked_value=""/>
    <set list_selection=""/>
  </do>
  <do onchange_="@clicked_value">
    <set list_title="{@clicked_value} PRODUCT LIST"/>
    <set list_selection=""/>
  </do>
  <do onchange_="@list_selection" base_="{@product_master}"
   value_="@item_title" row_="1" col_="1"
   when_="{@list_selection <> ''}">
    <sel value="sku={@list_selection}"/>
    <colord cols="description"/>
  </do>
  <layout background_="lightblue" border_="10">
    <widget class_="dropdown" base_="{@product_master}"
     inputwidth_="250" value_="@selection"
     label_="Department:" labelwidth_="75">
      <tabu label="Tabulation on Product Master" breaks="deptdesc">
        <break col="deptdesc" sort="up"/>
        <tcol source="dept" name="dept" fun="first" label="First`Department"/>
      </tabu>
      <colord cols="dept,deptdesc"/>
    </widget>
    <widget class_="dropdown" value_="@aggregate_by"
     label_="Aggregate by:" labelwidth_="75" inputwidth_="250">
      <table>groupdesc_prod,Group;brand_prod,Brand
      </table>
    </widget>
    <widget class_="checkbox" label_="Display Chart"
     value_="@display_chart"/>
    <widget class_="button" text_="Run" type_="submit"/>
    <ignore>
      <widget class_="text" text_="Current selection: {@selection}"/>
    </ignore>
  </layout>
  <layout>
    <layout>
      <widget class_="grid" base_="{@sales_detail}"
       insert_="sales_by_date" prod_table="{@product_master}"
       department="{@selection}" group_by="{@aggregate_by}"
       invmsg_="Click Run for changes to take effect"
       holdfor_="@aggregate_by,@selection"
       clickable_="{@aggregate_by}" value_="@clicked_value"/>
      <widget class_="graphics" base_="{@sales_detail}" width_="800"
       insert_="sales_by_date" prod_table="{@product_master}"
       department="{@selection}" group_by="{@aggregate_by}"
       invmsg_="Click Run for changes to take effect"
       visible_="{@display_chart}" holdfor_="@aggregate_by,@selection">
        <graphspec>
          <chart type="bar">
            <data x="{@aggregate_by}" y="tot_sales"/>
            <ticks xrot="45"/>
            <style xaxissize="10" yaxissize="10"/>
          </chart>
        </graphspec>
      </widget>
    </layout>
    <layout>
      <widget class_="list" base_="{@product_master}"
       width_="500" maxheight_="600"
       require_="{@clicked_value <> ''}" invmode_="hide"
       label_="{@list_title}" value_="@list_selection">
        <if test="{@aggregate_by = 'brand_prod'}">
          <then>
            <sel value="(brand='{@clicked_value}')"/>
          </then>
          <else>
            <sel value="(groupdesc='{@clicked_value}')"/>
          </else>
        </if>
        <colord cols="sku,description"/>
        <sort col="description" dir="up"/>
      </widget>
      <widget class_="graphics" base_="{@sales_detail}"
       width_="800" height_="400" invmode_="hide"
       require_="{@list_selection <> ''}">
        <if test="{@list_selection <> ''}">
          <sel value="between(trans_date;{@startdate};{@enddate})"/>
          <sel value="(sku={@list_selection})"/>
          <tabu label="Tabulation on Sales Detail" breaks="trans_date,sku">
            <tcol source="xsales" fun="sum" name="tot_sales_by_date"
             label="Sum of`Extended`Sales" format="type:currency"/>
          </tabu>
          <willbe name="date" value="trans_date" format="type:date4y"/>
          <graphspec>
            <chart type="line" title="{@item_title}">
              <axes xlabel="Date"/>
              <data x="date" y="tot_sales_by_date"/>
              <ticks xrot="45"/>
              <style xaxissize="10" yaxissize="10"/>
            </chart>
          </graphspec>
        </if>
      </widget>
    </layout>
  </layout>
</dynamic>