
Specify conditions for widget validation
While a widget is in an invalidated state, you can hide the widget so that it is not visible to the user. You may want to require that certain conditions are met for a widget to be validated.
For example, when the user clicks an item in the list widget, you might want to
display a graphics widget showing a line graph of the sales for that item over a particular
time period. However, you would not want to display the graphics widget if the user has not
selected anything in the list widget. You can do this by setting the
require_ attribute for the graphics widget to be true only when the
dynamic variable associated with the list widget has been set to something.
To specify conditions for widget validation:
Because of the condition specified in the require_ attribute for the new
graphics widget, the graphics widget will be invalidated and subsequently hidden if the
list_selection dynamic variable is set to the empty string. Therefore,
the new graphics widget will only be displayed once a selection has been made in the list
widget.
If the user clicks a different item in the grid widget, the list widget will be refreshed
to show the SKUs related to the new item. The line chart related to the previously
selected SKU in the list widget should no longer be shown. To hide the graphics widget
containing the line chart, you can simply set list_selection to the empty
string in the <do> clause where
onchange_="@clicked_value".
Furthermore, just as in Do something when a variable changes, if the user
changes a value in the Department or Aggregate
by drop-down widgets, the new graphics widget should be hidden until the
user makes a new selection in the list widget. To hide the graphics widget in this case,
set list_selection to the empty string in the <do>
clause where onchange_="@aggregate_by,@selection".
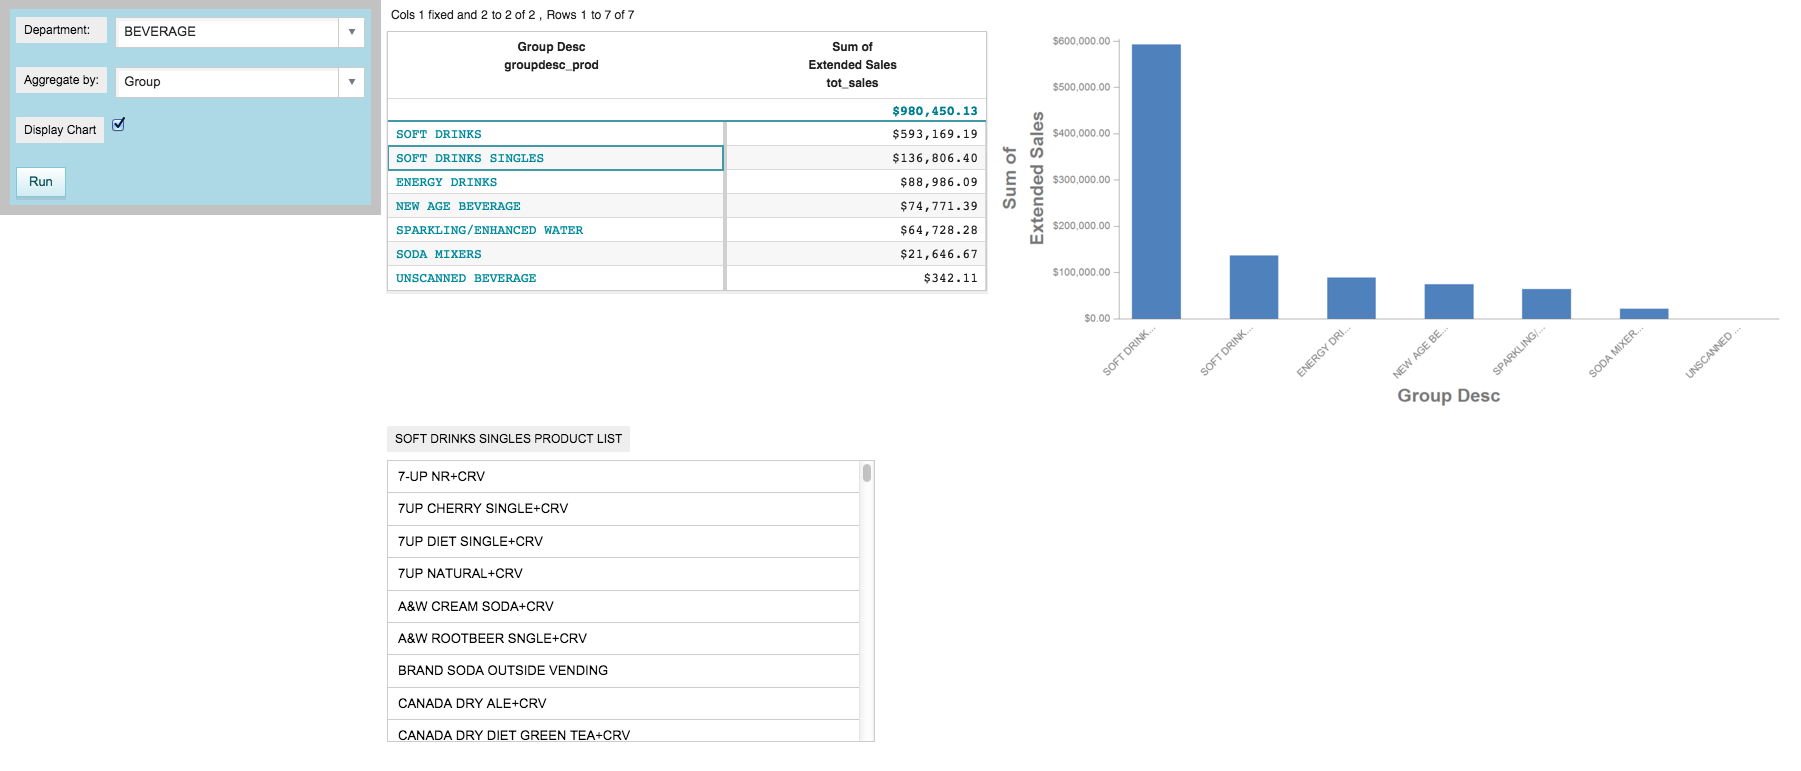
-
Click an item in the grid widget (e.g., SOFT DRINKS
SINGLES).
The list widget appears as expected.
-
Click an item in the list widget (e.g., A&W ROOTBEER
SNGLE+CRV).
The graphics widget containing the line chart appears to the right of the list widget.
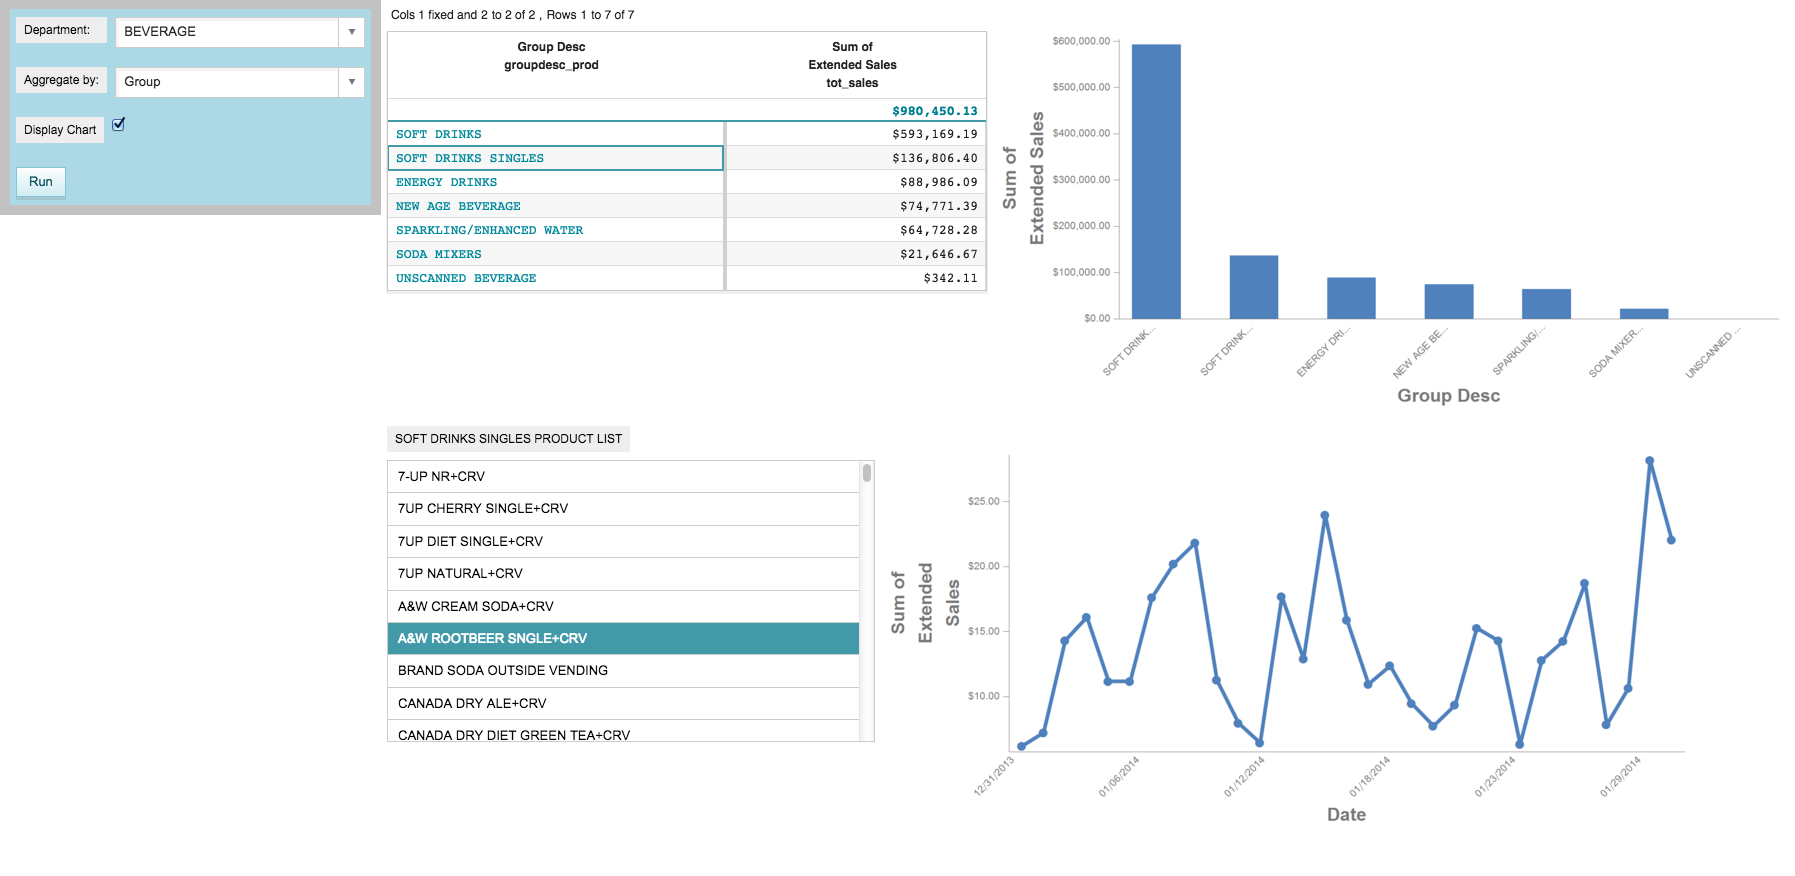
Changing the selection in the list widget automatically updates the graphics
widget containing the line chart, since its query uses the value of
list_selection.
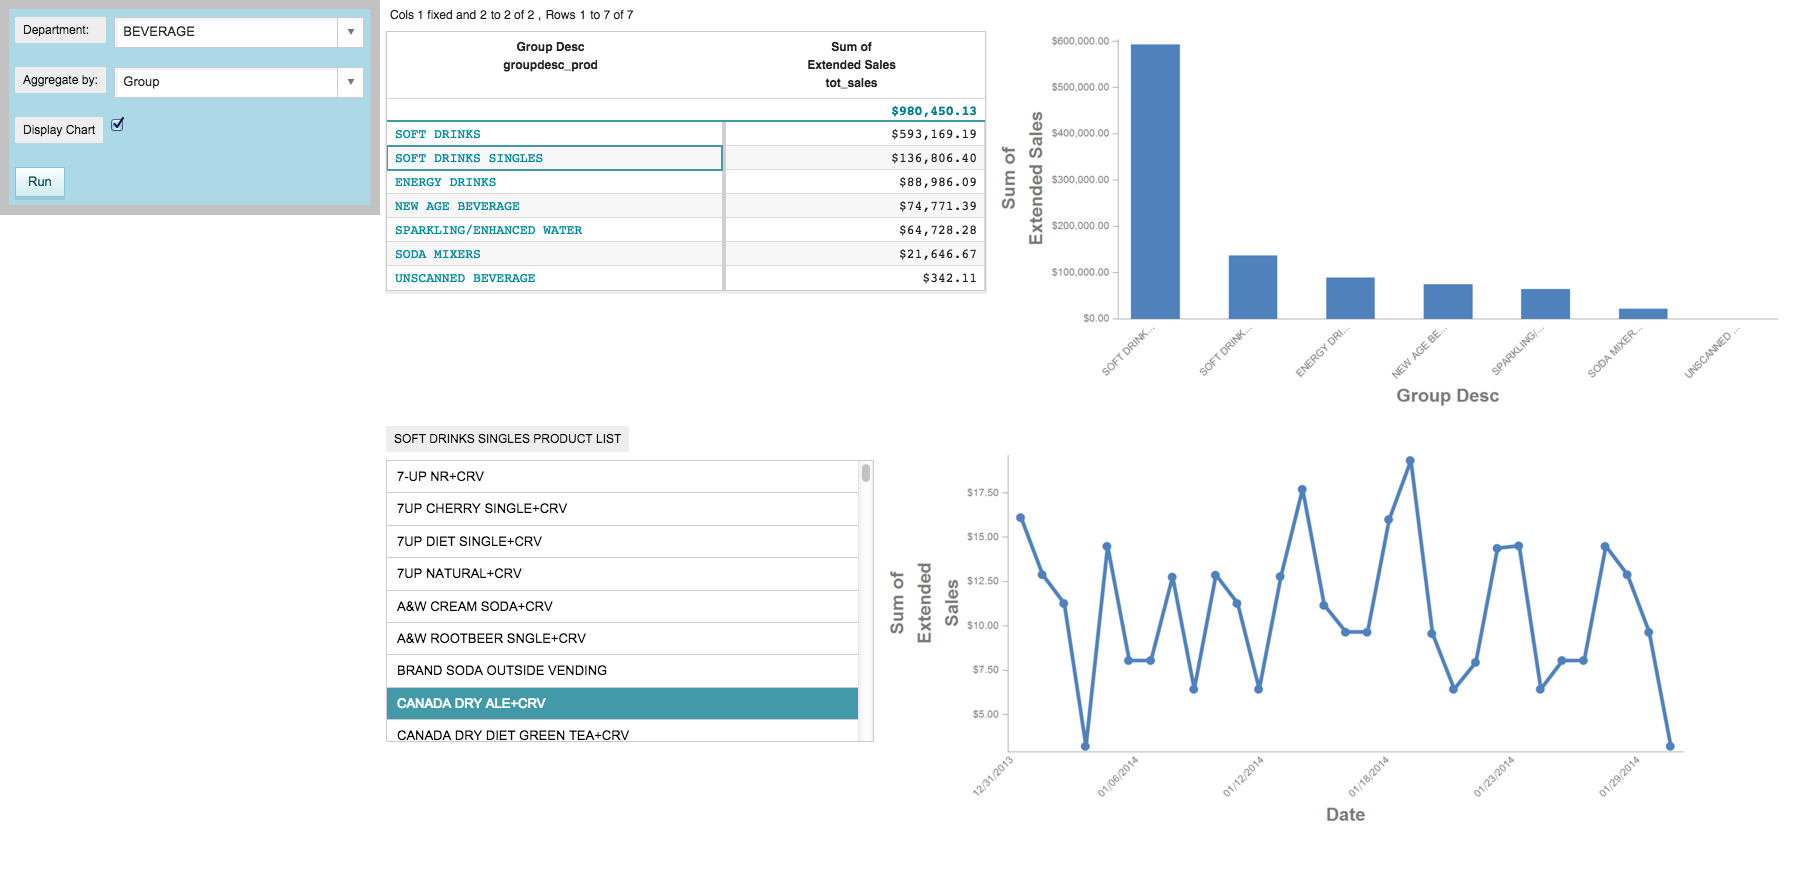
-
Click a different item in the list widget (e.g., CANADA DRY
ALE+CRV).
The graphics widget containing the line chart is updated to reflect the new selection in the list widget.
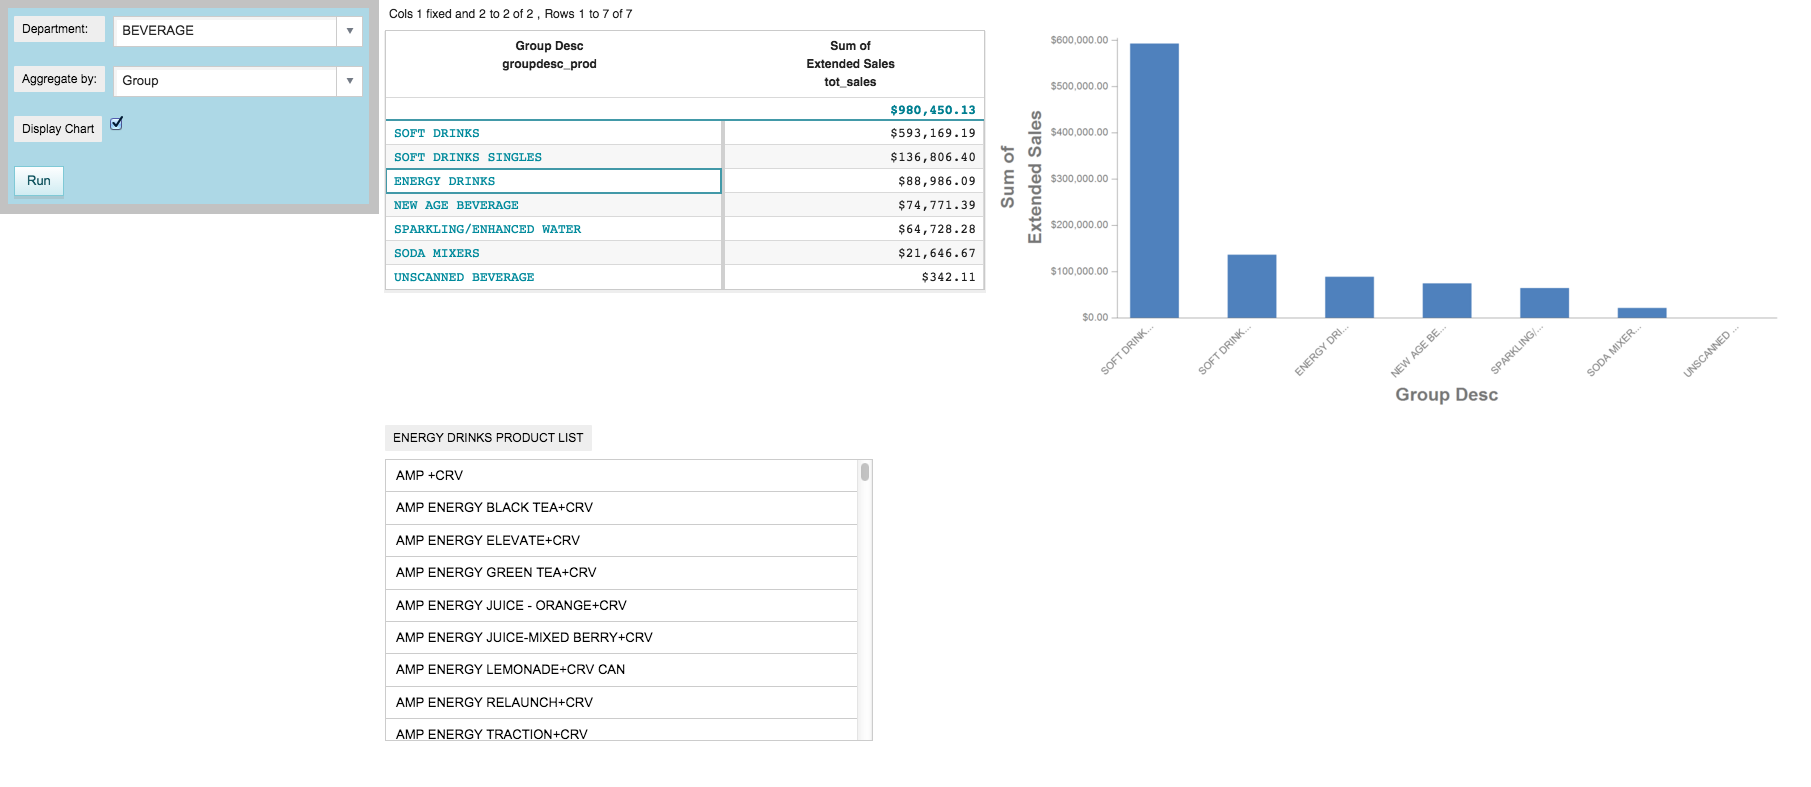
If the user selects a different group description in the grid widget, the list
widget is updated accordingly, and the graphics widget containing the line chart is hidden,
since list_selection is set to the empty string in the
<do> clause where
onchange_="@clicked_value".
-
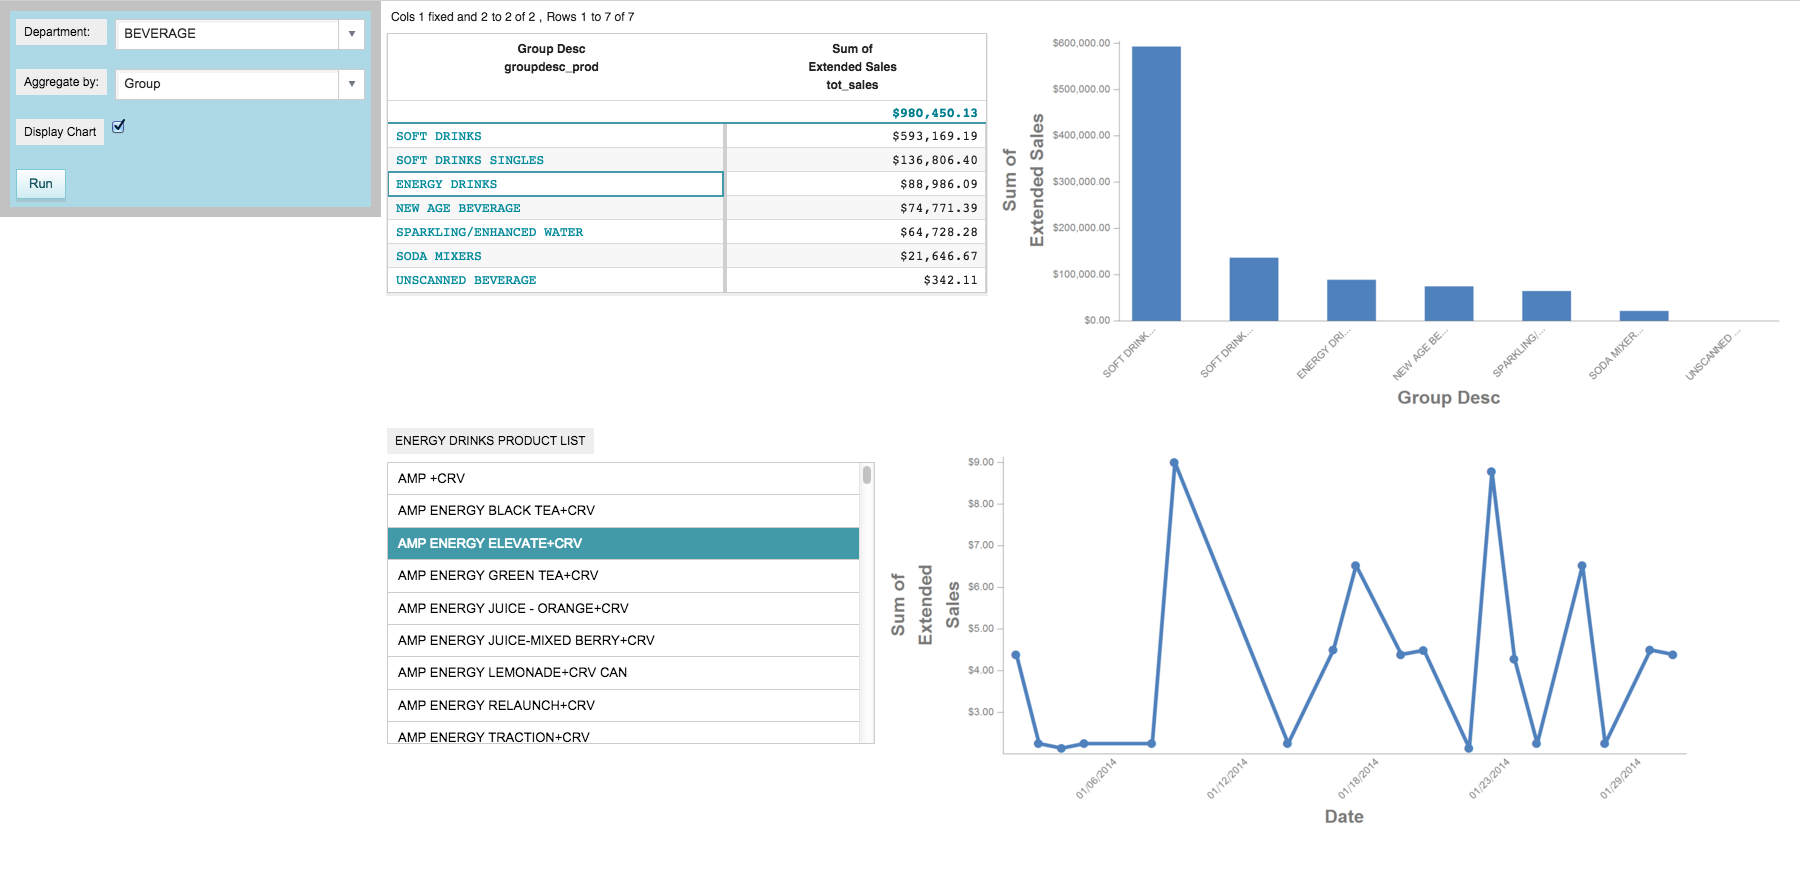
Click an item in the grid widget (e.g., ENERGY DRINKS).
The list widget is updated to show the item descriptions associated with the group description selected in the grid widget, and the graphics widget containing the line chart is hidden.
-
Click an item in the list widget (e.g., AMP ENERGY
ELEVATE+CRV).
The graphics widget containing the line chart appears to the right of the list widget.
If the user changes a value in the Department or
Aggregate by drop-down widgets, both the list widget and the
graphics widget containing the line chart are hidden because the
clicked_value and list_selection dynamic variables are
each set to the empty string in the <do> clause where
onchange_="@aggregate_by,@selection".
-
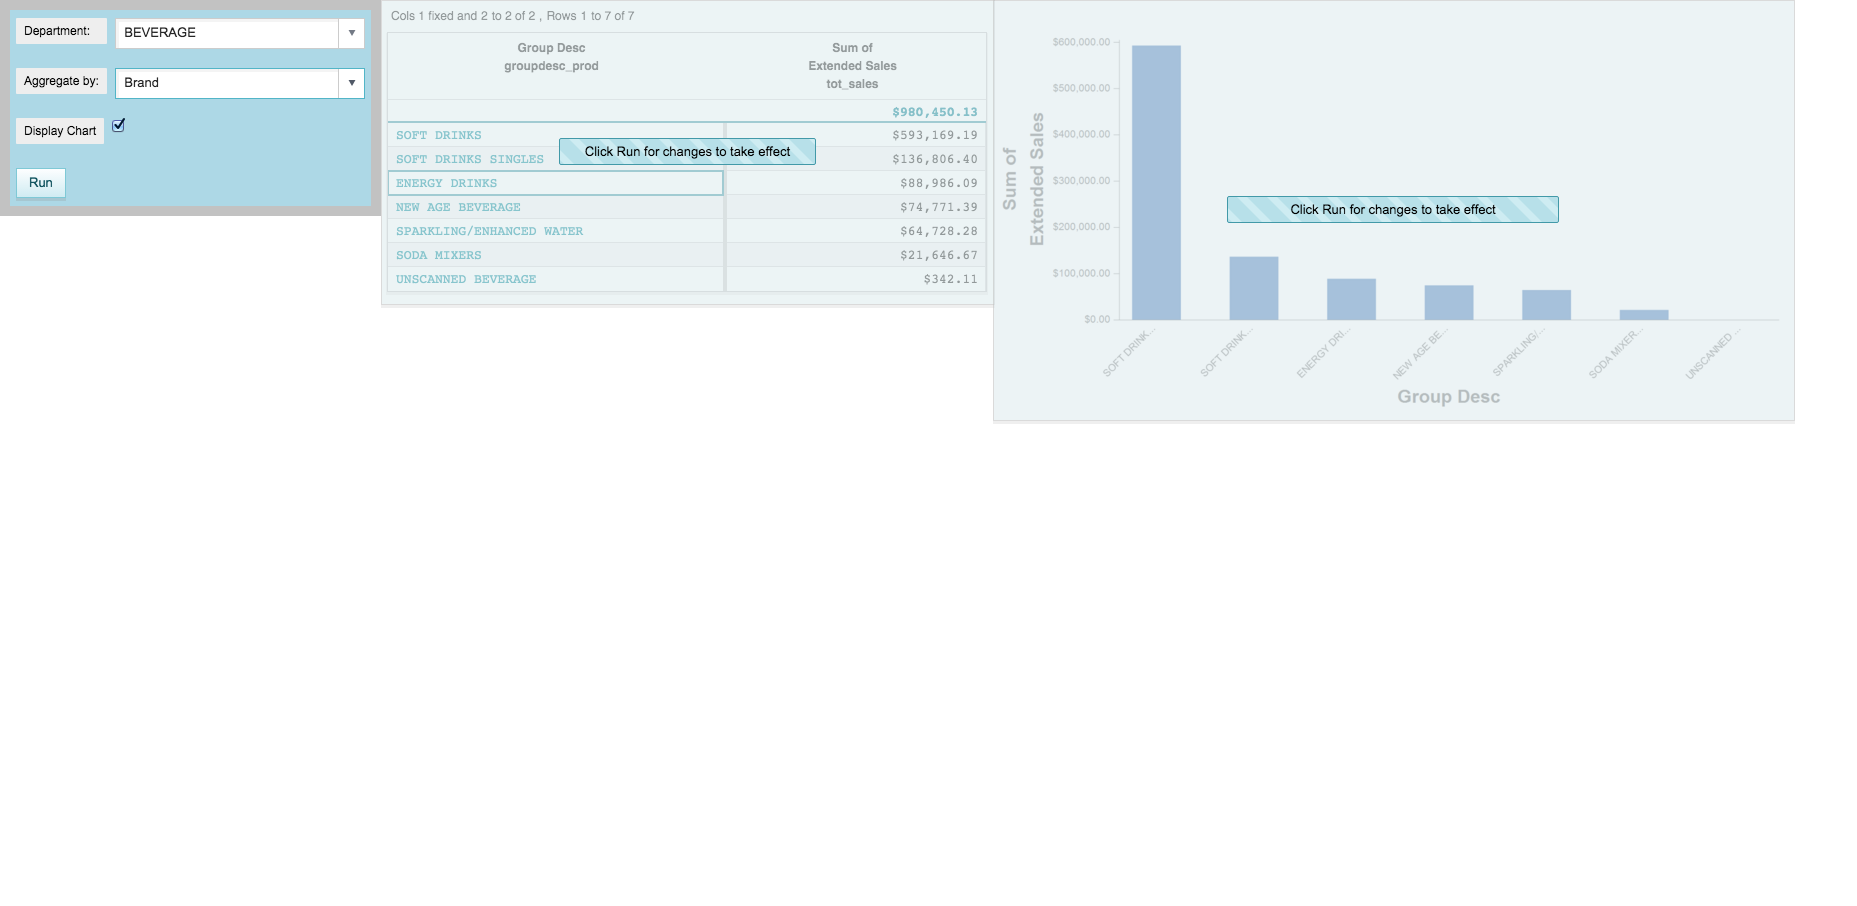
Select Brand from the Aggregate
by drop-down menu.
The grid widget and graphics widget containing the bar chart are invalidated and blocked, and the list widget and graphics widget containing the line chart are hidden.
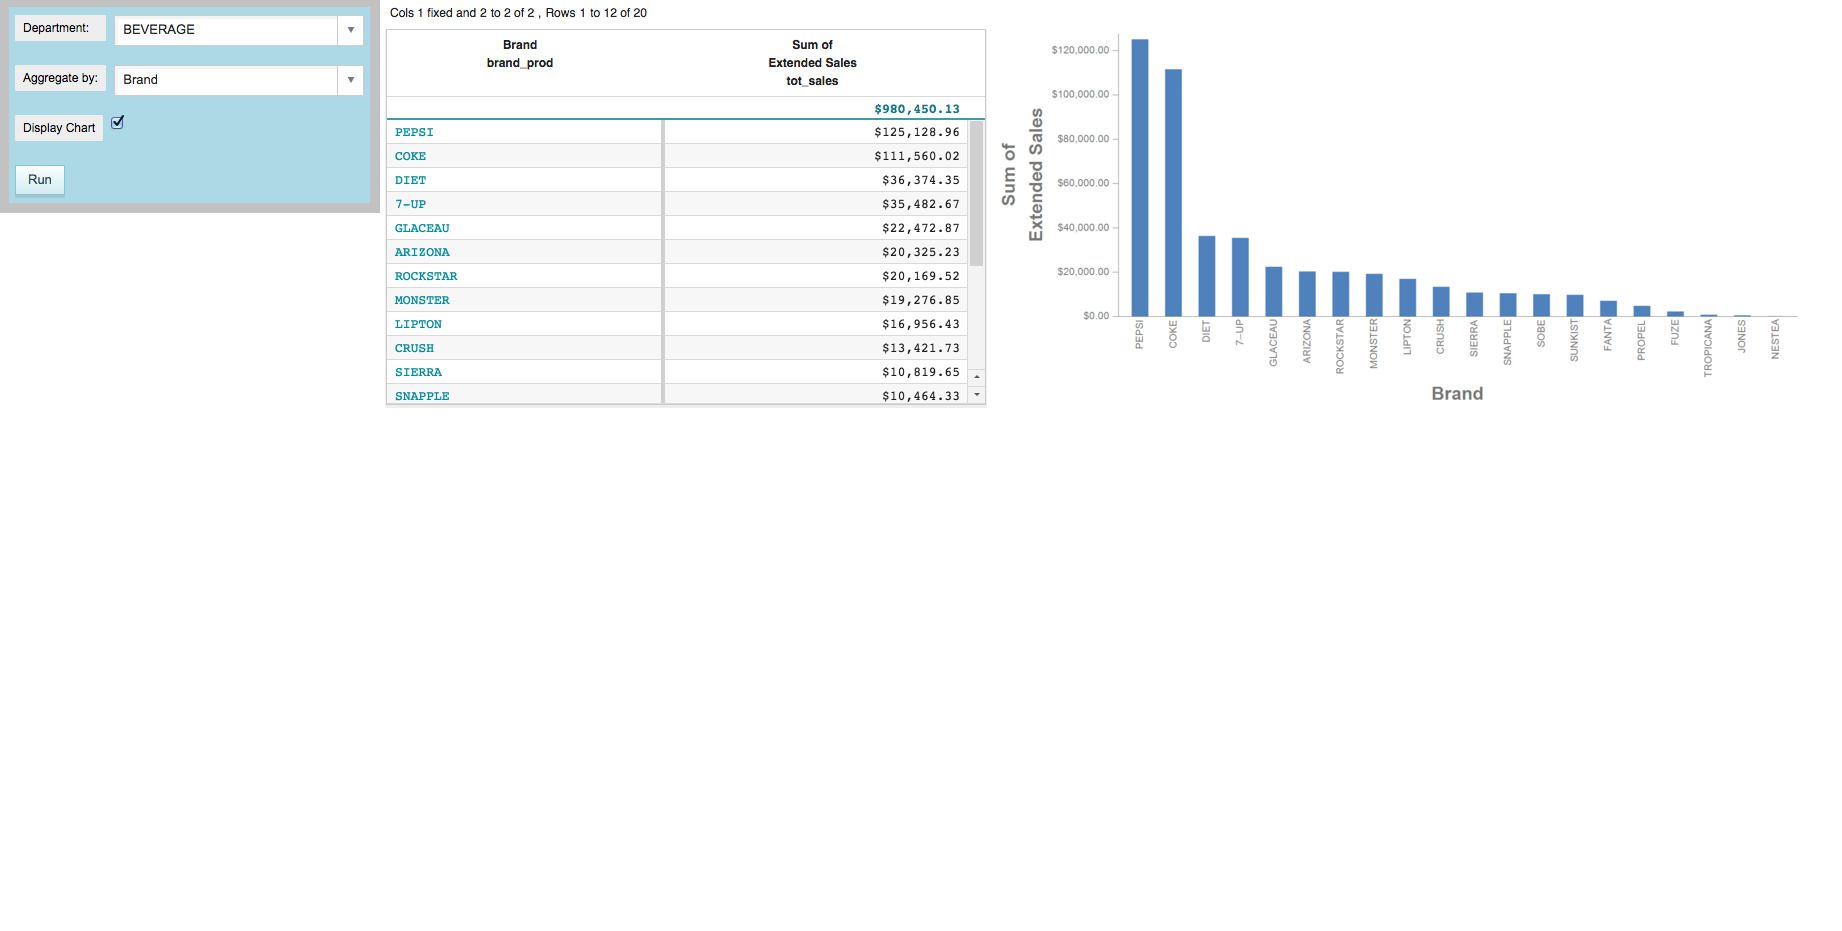
-
Click Run.
The grid widget and graphics widget containing the bar chart are updated, and the list widget and graphics widget containing the line chart are still invalidated and remain hidden.
Cumulative QuickApp code
The Macro Language code for the QuickApp up to this point is:
<defblock name="sales_by_date" prod_table="" department="" group_by="">
  <link table2="{@prod_table}" col="sku" col2="sku"
   suffix="_prod" type="select">
    <sel value="dept={@department}"/>
  </link>
  <tabu label="Tabulation on Sales Detail" breaks="{@group_by}">
    <tcol source="xsales" fun="sum" name="tot_sales"
     label="Sum of`Extended Sales" format="type:currency"/>
  </tabu>
  <sort col="tot_sales" dir="down"/>
  <sel value="({@group_by} <> '')"/>
</defblock>
<dynamic selection="19" product_master="pub.doc.retail.product"
 sales_detail="pub.doc.retail.salesdetail" aggregate_by="groupdesc_prod"
 mode_="auto" display_chart="1" clicked_value="" list_title="PRODUCT LIST"
 list_selection="" startdate="20140101" enddate="20140131">
  <do onchange_="@aggregate_by,@selection">
    <set clicked_value=""/>
    <set list_selection=""/>
  </do>
  <do onchange_="@clicked_value">
    <set list_title="{@clicked_value} PRODUCT LIST"/>
    <set list_selection=""/>
  </do>
  <layout background_="lightblue" border_="10">
    <widget class_="dropdown" base_="{@product_master}"
     inputwidth_="250" value_="@selection"
     label_="Department:" labelwidth_="75">
      <tabu label="Tabulation on Product Master" breaks="deptdesc">
        <break col="deptdesc" sort="up"/>
        <tcol source="dept" name="dept" fun="first" label="First`Department"/>
      </tabu>
      <colord cols="dept,deptdesc"/>
    </widget>
    <widget class_="dropdown" value_="@aggregate_by"
     label_="Aggregate by:" labelwidth_="75" inputwidth_="250">
      <table>groupdesc_prod,Group;brand_prod,Brand
      </table>
    </widget>
    <widget class_="checkbox" label_="Display Chart"
     value_="@display_chart"/>
    <widget class_="button" text_="Run" type_="submit"/>
    <ignore>
      <widget class_="text" text_="Current selection: {@selection}"/>
    </ignore>
  </layout>
  <layout>
    <layout>
      <widget class_="grid" base_="{@sales_detail}"
       insert_="sales_by_date" prod_table="{@product_master}"
       department="{@selection}" group_by="{@aggregate_by}"
       invmsg_="Click Run for changes to take effect"
       holdfor_="@aggregate_by,@selection"
       clickable_="{@aggregate_by}" value_="@clicked_value"/>
      <widget class_="graphics" base_="{@sales_detail}" width_="800"
       insert_="sales_by_date" prod_table="{@product_master}"
       department="{@selection}" group_by="{@aggregate_by}"
       invmsg_="Click Run for changes to take effect"
       visible_="{@display_chart}" holdfor_="@aggregate_by,@selection">
        <graphspec>
          <chart type="bar">
            <data x="{@aggregate_by}" y="tot_sales"/>
            <ticks xrot="45"/>
            <style xaxissize="10" yaxissize="10"/>
          </chart>
        </graphspec>
      </widget>
    </layout>
    <layout>
      <widget class_="list" base_="{@product_master}"
       width_="500" maxheight_="600"
       require_="{@clicked_value <> ''}" invmode_="hide"
       label_="{@list_title}" value_="@list_selection">
        <if test="{@aggregate_by = 'brand_prod'}">
          <then>
            <sel value="(brand='{@clicked_value}')"/>
          </then>
          <else>
            <sel value="(groupdesc='{@clicked_value}')"/>
          </else>
        </if>
        <colord cols="sku,description"/>
        <sort col="description" dir="up"/>
      </widget>
      <widget class_="graphics" base_="{@sales_detail}"
       width_="800" height_="400" invmode_="hide"
       require_="{@list_selection <> ''}">
        <if test="{@list_selection <> ''}">
          <sel value="between(trans_date;{@startdate};{@enddate})"/>
          <sel value="(sku={@list_selection})"/>
          <tabu label="Tabulation on Sales Detail" breaks="trans_date,sku">
            <tcol source="xsales" fun="sum" name="tot_sales_by_date"
             label="Sum of`Extended`Sales" format="type:currency"/>
          </tabu>
          <willbe name="date" value="trans_date" format="type:date4y"/>
          <graphspec>
            <chart type="line">
              <axes xlabel="Date"/>
              <data x="date" y="tot_sales_by_date"/>
              <ticks xrot="45"/>
              <style xaxissize="10" yaxissize="10"/>
            </chart>
          </graphspec>
        </if>
      </widget>
    </layout>
  </layout>
</dynamic>