
Using conditional formatting
Conditional formatting allows you to easily distinguish data in a table or chart.
Difficulty

Objective
You have a table of total sales for 18 different stores and you would like to use conditional formatting to differentiate between the highest and the lowest sales. You know how to use the Conditional Formatting tool in Excel to create a three color scale that is applied to the table, and you would like to obtain the same visualization using 1010data.
Excel solution
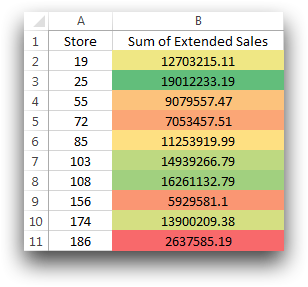
Excel's Conditional Formatting tool has many different options to visualize aspects of your data table. After highlighting the data you wish to format, all that is required is to select from the menu witch option you desire. For this analogue, a three color scale where red shows the lowest sales and green shows the highest sales, is chosen. Below is an image of the formatted table.
1010data Macro Language solution
<dynamic>
  <widget class_="grid" type_="scroll" width_="400" height_="600"
   label_="Sum of Sales Per Store"
   base_="pub.doc.retail.altseg.sales_detail_transid"
   colstwtbgcolor_="sum_xsales" bgcolorforcol_="sum_xsales_color">
    <tabu label="Sum of Sales Per Store" breaks="store">
      <break col="store" sort="up"/>
      <tcol source="xsales" fun="sum" name="sum_xsales"
       label="Sum of`Extended`Sales"/>
    </tabu>
    <willbe name="sum_xsales_color"
     value="if(between(sum_xsales;0;3000000);'#f7363d';
               between(sum_xsales;3000000;7000000);'#fa532e';
               between(sum_xsales;7000000;9000000);'#fd8535';
               between(sum_xsales;9000000;11000000);'#feb367';
               between(sum_xsales;11000000;13000000);'#fed167';
               between(sum_xsales;13000000;14000000);'#fff68f';
               between(sum_xsales;14000000;15000000);'#e3f385';
               between(sum_xsales;15000000;16500000);'#bdf575';
               between(sum_xsales;16500000;20000000);'#94d765';
               NA)"/>
  </widget>
</dynamic>
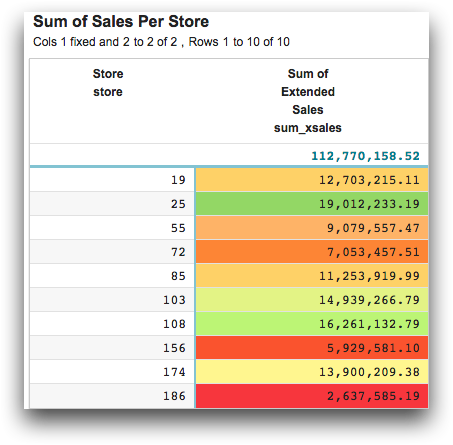
A similar looking table to the one created in Excel, can be obtained by using 1010data. In
order to conditionally format the table, you need to create a Quickapp using the
<dynamic> operation. Within these tags, a widget with
class_="grid" is used as the display for the table. The given tabulation
is used to determine the sum of sales per store. In order to apply the desired formatting,
two attributes are used within the widget to specify which column is going to be receiving
the formatting and which column will supply the colors to be used in the formatted column.
These attributes are colstwtbgcolor and bgcolorforcol,
respectively.
The column that supplies the colors is created using the <willbe>
operation where the value is determined by an if(C1;R1;C2;R2;...;D)
statement. For each range that you wish to hold a different color, a
between(X;Y;Z) statement is used for the condition and the desired color
is used for the result. These colors are determined by using the color-hex code. In this
analogue, the ranges and colors are selected to mimic the solution created in Excel. The
completed result can be seen below.
As you can see from the supplied Macro Language for this solution, using 1010data is not exactly easier than using Excel when it comes to conditionally formatting tables. All that is required in Excel is for the user to select an option from a menu. With 1010data, the user must determine the ranges to hold each color and also find the desired color's code, all while immersing these decisions in 9 lines of code. While this process does allow the user more flexibility in their formatting, it can be a much lengthier process.
However, adding conditional formatting to an Excel table can cause the program to run at a much slower speed. While using a table of 19 rows won't slow the operations of Excel, a table with several thousand rows will certainly create lag time. Therefore, although creating a table with Excel is significantly easier, it is not always the better choice, especially when dealing with large tables.
Further reading
If you would like to learn more about the functions and operations discussed in this recipe, click on the links below: