<tabu>
<tabu> defines a tabulation or cross-tabulation.
Description
A tabulation summarizes data by grouping and aggregating related data. For instance, if a tabulation summarizes the average temperature by city for a whole year, the city is the group and the temperature is the metric being aggregated by averaging all the temperatures on record for a given year.
The result of a tabulation is a table with columns for each break column specified by the
breaks attribute and one result column for each aggregation specified
with an individual <tcol> element. (See <tcol> for details.)
In the resultant table, the break columns retain their original names. To provide a
different name for a break column or specify how it is to be sorted, optional
<break> elements can be inserted between the opening and closing tags
of the <tabu> element. See <break> for more information.
By default, the result columns are named t0, t1, etc.
However, the result columns can be named using the name attribute in each
of the <tcol> elements.
The cbreaks attribute specifies the columns for a cross-tabulation. If
cbreaks is specified, the result is a table with one column for each
row-break column (defined by the breaks attribute), another column
containing row totals, and additional columns for each unique combination of column-break
values.
In the resultant table, the row-break columns retain their original names (though they can
be changed using the <break> element), the total column is called
t0, and the result columns are named m0,
m1, etc. (In the event of name collisions, special rules apply.) A
<tcol> tag defines the type of aggregation.
As of version 10.17, cross tabulations may contain multiple
<tcol> elements, allowing for multi-metric cross tabulations.
The columns specified by the multiple <tcol>
elements are grouped together under each column break, and the row-total columns appear at
the beginning in <tcol> order.
For instance, if there are m
<tcol> elements and n values in the column breaks, there will be
a total of m*(1+n) columns, which will be named: t0,
t1, ..., tm, m0_0,
m1_0, ..., mm_0,
m0_1, m1_1, ...,
mm_1, ...,m0_n,
m1_n, ..., mm_n. (This is
an extension of the regular naming scheme for cross-tabulations.)
Syntax
<tabu label="[TITLE_OF_TABULATION]"
       breaks="[COLUMN(S)_TO_GROUP_BY]">
           <tcol source="[COLUMN(S)_TO_SUMMARIZE]"
              fun="[NAME_OF_FUNCTIONS]"
              label="[NAME_OF_NEW_COLUMN]"/>
</tabu>
Attributes
label- Accepts a text value that specifies the title for the results table. If omitted, the system supplies a default value.
breaks- A list of the names of the grouping ("break") columns (real or computed), separated by
commas. All records that have the same values for these columns will be grouped
together. For cross tabs,
breaksspecifies the row breaks only. If omitted, all rows are treated as being in one group.You can use an expression in the
breaksattribute. cbreaks- A list of names of the column-break columns (real or computed), separated by commas.
All records that have the same values for these columns will be grouped together. If
omitted, the result is a straight tabulation.
You can use an expression in the
cbreaksattribute. clabels- Accepts either the value
longor the valueshort, indicating, for cross tabulations, whether the column headings of the result columns should include the grouping column names.If
clabels="long", the column headings of the result columns will include the grouping column names and look something likeColor=red Size=large. Ifclabels="short", only the grouping columns' values will be used (e.g.,red large). xtab- The expression
xtab=0indicates that a cross-tabulation should be "unrolled." This means that for each group inbreaks, there will be one row for each group incbreaks. The result is thus displayed in the form of a regular tabulation, with as many columns as there are<tcol>elements, but with one row for each possible combination ofbreaksandcbreaks. For combinations that do not occur, the result isNA, just as in a cross-tabulation.
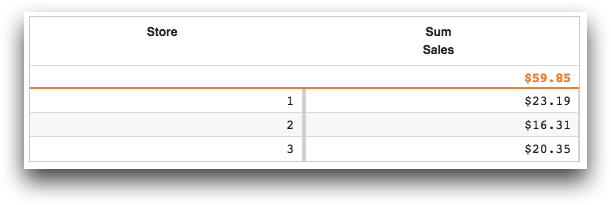
Example: Tabulation
This example features a tabulation that aggregates the total sales for each store in the table pub.demo.retail.item.
<base table="pub.demo.retail.item"/>
<tabu label="Sales by Store" breaks="store">
  <tcol source="sales" fun="sum" format="type:currency;dec:2"/>
</tabu>
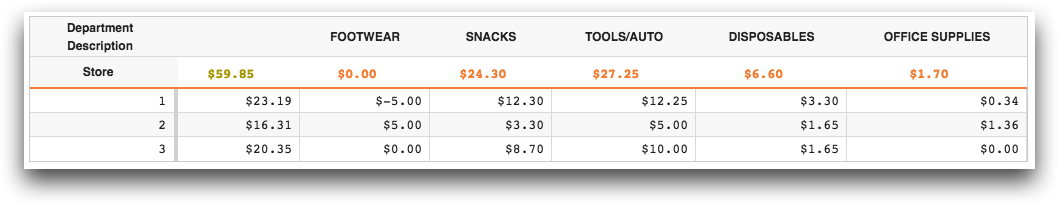
Example: Cross tabulation
breaks attribute). The first column in the
table contains the stores, the second displays the row totals, and the remaining columns
show the total sales for each department (as specified by the cbreaks
attribute). _pm is appended to the column names from the product
master table.<base table="pub.demo.retail.item"/> <link table2="pub.demo.retail.prod" col="sku" col2="sku" suffix="_pm"/> <tabu label="Sales by Store by Department" breaks="store" cbreaks="deptdesc_pm" clabels="short"> <tcol source="sales" fun="sum" format="type:currency;dec:2"/> </tabu>
When applied to the table the results appear as follows:
0.00 for N/A values. Tabulations do
not.Example: Multi-metric cross tabulation
As of version 10.17, cross tabulations can contain multiple
<tcol> elements, allowing for multi-metric cross tabulations.
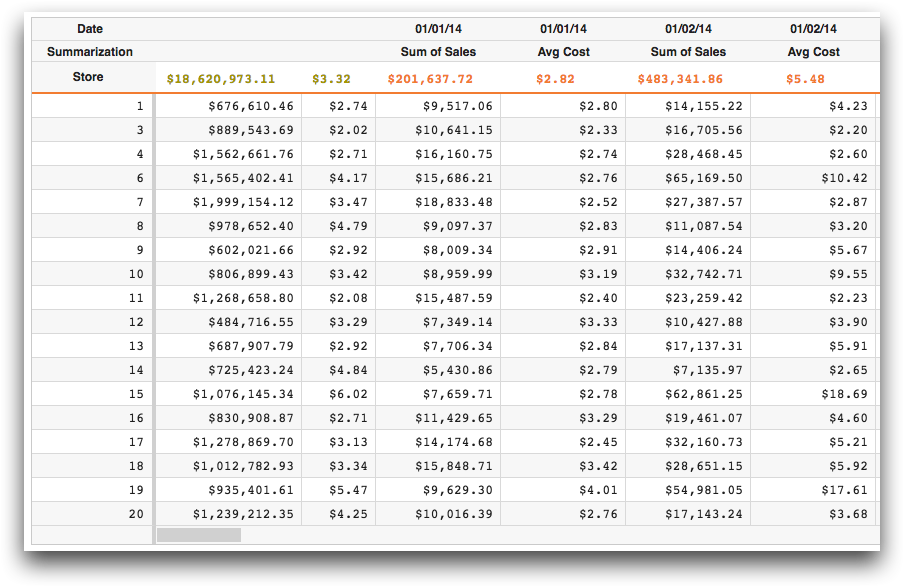
This example shows a multi-metric cross tabulation that aggregates both the sum of extended
sales and the average cost broken out by transaction date for every store in the table
pub.doc.retail.salesdetail. The resultant table contains one row for
every store (as specified by the breaks attribute). The first column in the
table contains the stores, the second displays the row totals related to the sum of extended
sales, the third shows the row totals for the average cost, and the remaining columns show
the total sales and average cost for each date (as specified by the cbreaks
attribute). The <tcol> labels appear in the last row in the header (as
specified by the cmorder attribute), and that row is labeled with the text
Summarization (as specified by the cmlabel
attribute). Note that the header uses the label specified with the
<tcol> associated with the sum of sales (Sum of
Sales) whereas a default label is used for the average cost
(Avg Cost) since no label was specified for
that <tcol>.
<base table="pub.doc.retail.salesdetail"/>
<tabu label="Sales by Store" breaks="store"
 cbreaks="trans_date" cmlabel="Summarization" cmorder="last">
  <break col="store" sort="up"/>
  <tcol fun="sum" source="xsales"
   label="Sum of Sales" format="type:currency"/>
  <tcol fun="avg" source="cost" format="type:currency"/>
</tabu>
When applied to the table the results appear as follows: