
Edit a chart
The Chart Builder allows you to modify existing charts that you have saved.
In this tutorial, you will modify the bar chart you created and saved in Create a bar chart. You will add more data to the chart and then change display preferences like colors and labels.
To take this tutorial, you must have completed Create a bar chart.
To edit a chart:
-
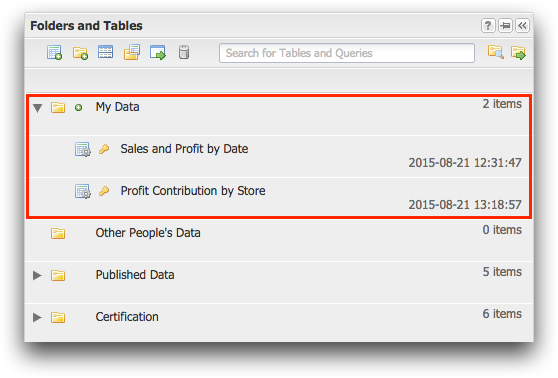
In the Folders and Tables browser, double-click the
Sales and Profit by Date Quick Query.
Your Quick Query is located in the My Data folder.
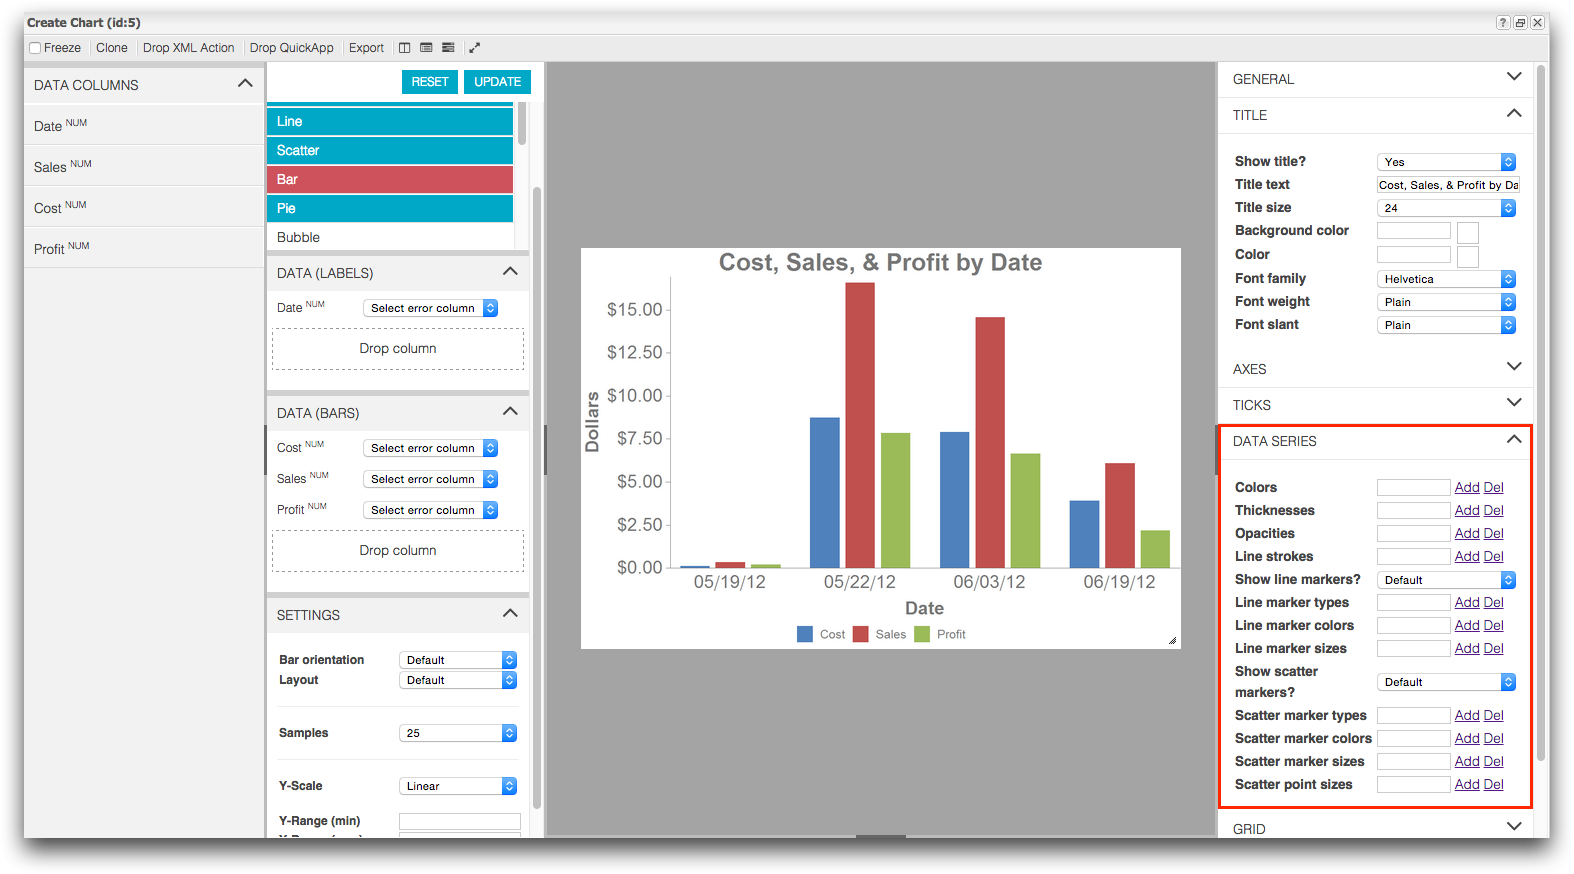
 1010data displays your bar chart in the Chart Builder in the Create Chart window.
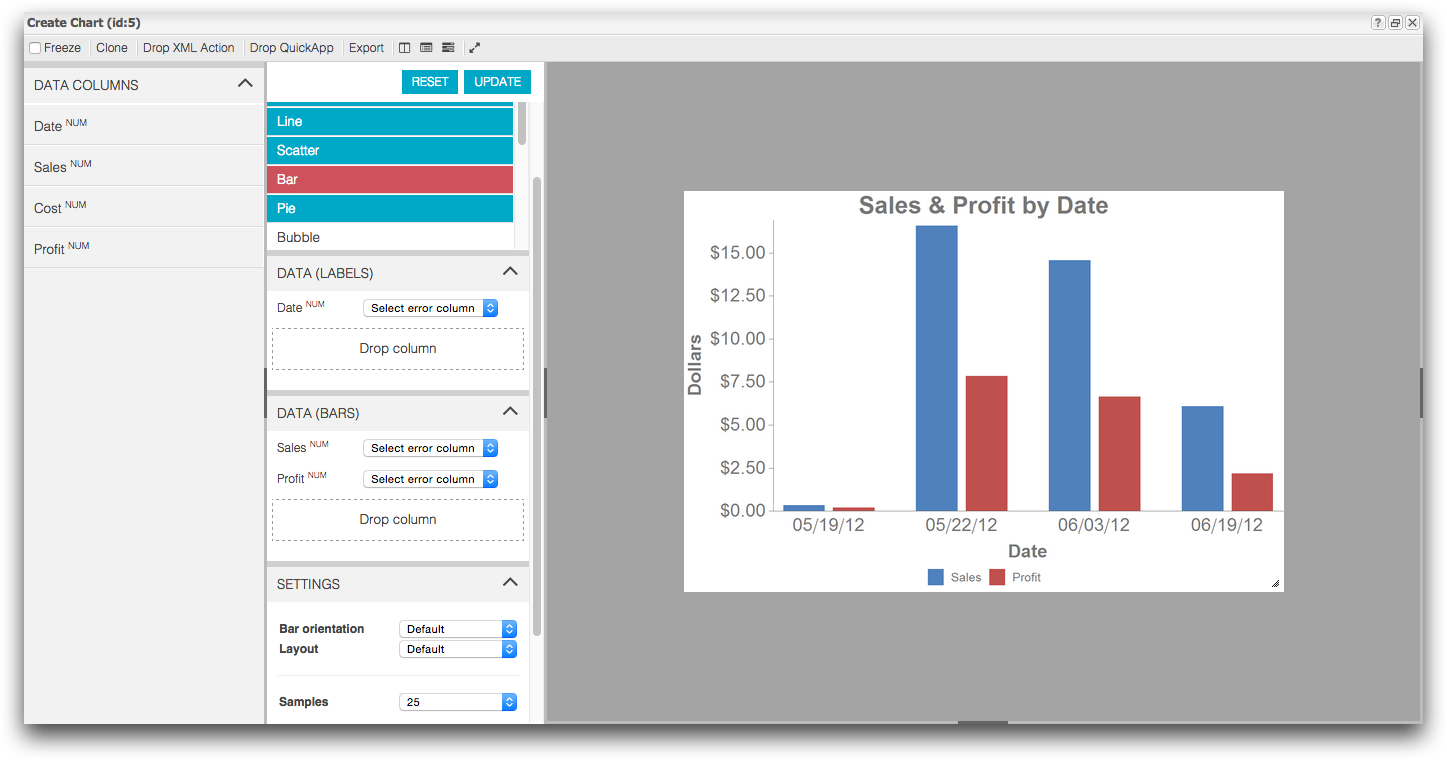
As you can see, your chart looks exactly as it did before you closed it. Now, you can edit the chart.
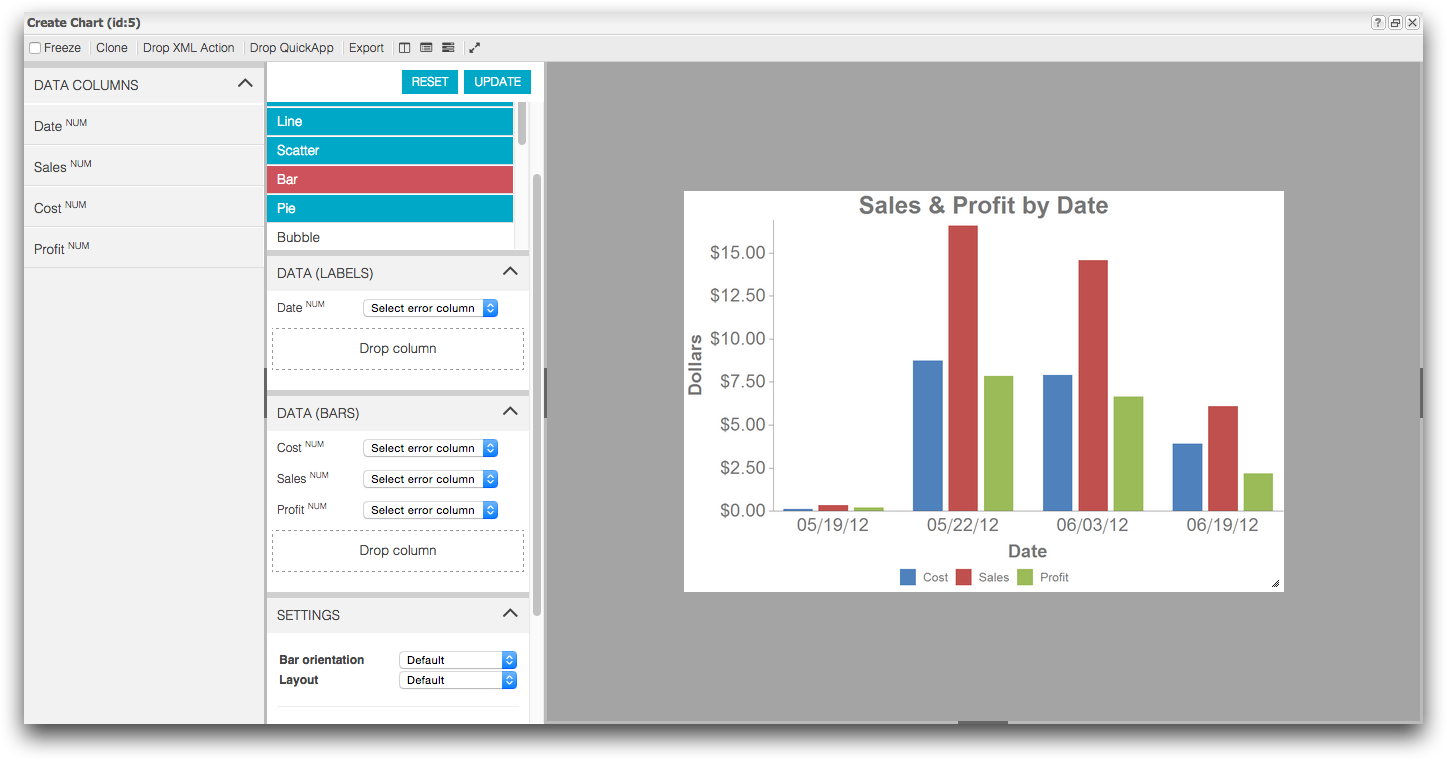
Add the Cost column to the chart so you can see how the cost of items sold relates the profit of the item.
-
Add the Cost column to your chart.
-
Click Update.
1010data updates your chart.
-
Click Update.
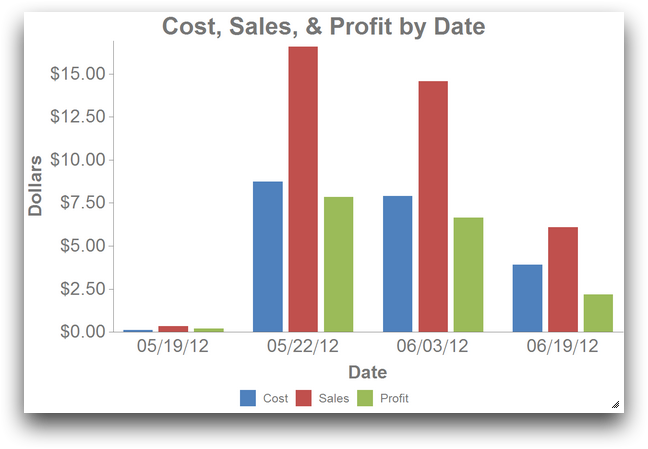
Now that more data is in your chart, the title does not make quite as much sense. Update the chart title to account for the additional information.
-
Update the chart title.
-
Click the Right Settings Panel (
 ) button.
-
Press Enter.
1010data updates the chart title.
-
Click the Right Settings Panel (
You can change the colors of the bars in the chart to suit your tastes. In the example above, it might make more sense to change Cost to red and Sales to blue.
-
Change the color of the bars in your chart.
-
In the Customization Panel, click
Data Series.
1010data displays the Data Series customization settings.
-
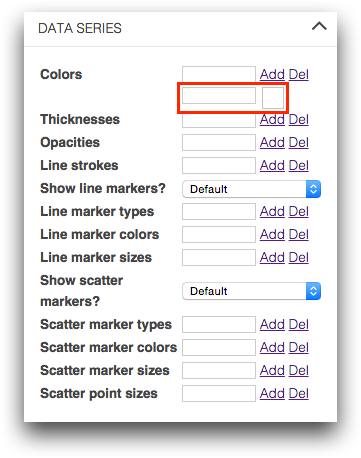
Next to the Colors field, click
Add.
1010data displays a blank field below the Colors field.
-
Click the newly added blank field.
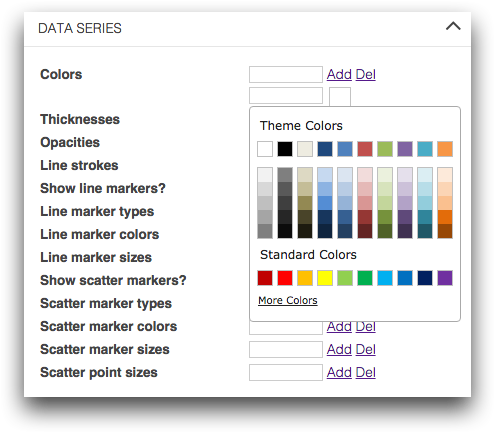
1010data displays the color palette.
-
In the Theme Colors section, click the red box
(
 ) in the top row.
1010data enters the hexadecimal code for the selected red color in the Colors field and changes all of the bars in the table to that color.Note: Since there is only one color entered in the Colors field, all of the bars are set to the selected red color. To change the bar color for the remaining two columns, repeat the process two more times. Each added color changes the bar color of the next column in the chart.
) in the top row.
1010data enters the hexadecimal code for the selected red color in the Colors field and changes all of the bars in the table to that color.Note: Since there is only one color entered in the Colors field, all of the bars are set to the selected red color. To change the bar color for the remaining two columns, repeat the process two more times. Each added color changes the bar color of the next column in the chart. -
Next to the Colors field, click
Add, then click the field that appears, and
finally, click the blue box (
 ) in
the top row.
1010data adds the hexadecimal code for the selected blue color in the Colors field and changes the Sales bars to blue.
) in
the top row.
1010data adds the hexadecimal code for the selected blue color in the Colors field and changes the Sales bars to blue. -
Next to the Colors field, click
Add, then click the field that appears, and
finally, click the green box (
 )
in the top row.
1010data adds the hexadecimal code for the selected green color in the Colors field and changes the Profit bars to green.
)
in the top row.
1010data adds the hexadecimal code for the selected green color in the Colors field and changes the Profit bars to green.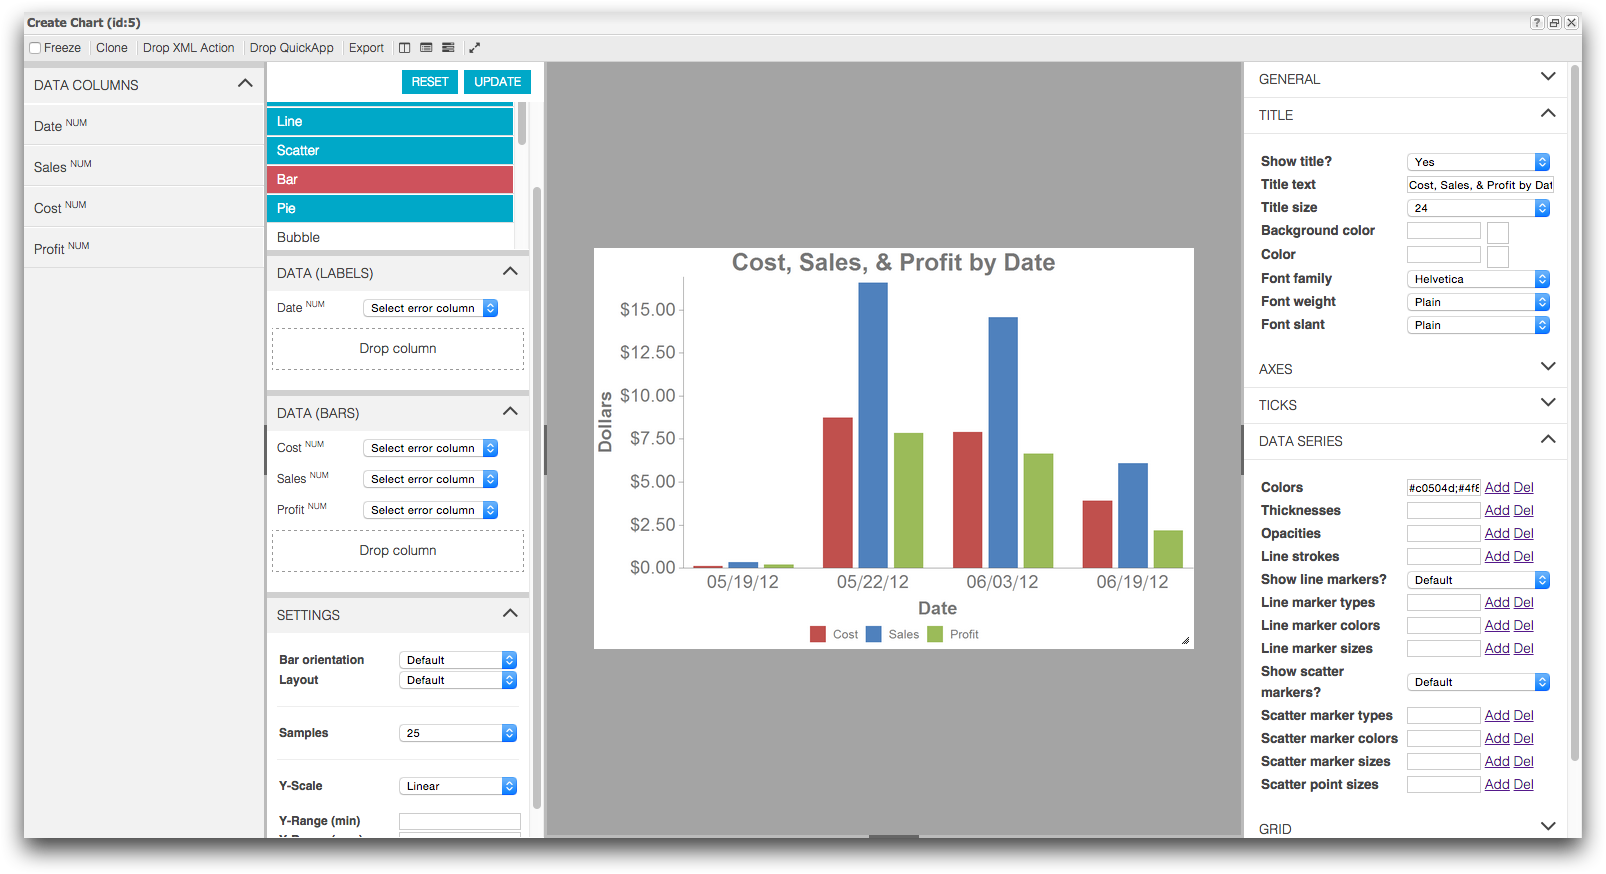
-
In the Customization Panel, click
Data Series.