
Building Your QuickApp
Now that we have a nice visualization of our data, the next step is to begin building a QuickApp. This will add flexibility and interactivity to the analysis by providing a clean user interface and allowing us to use that interface to change the values in the analysis without having to rewrite it.
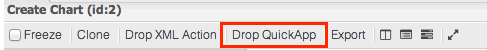
To actually start building a QuickApp that incorporates the chart we created in the last section, click Drop QuickApp at the top of the Chart Builder, as shown below:
A new Drop QA tab is opened in your 1010data session. If the tab isn't not automatically the active tab, then click on it at the bottom of the 1010data web GUI. Don't worry about its contents. (The table that is displayed is essentially metadata that the QuickApp will use). Next, click the View menu, then click Show QuickApp....
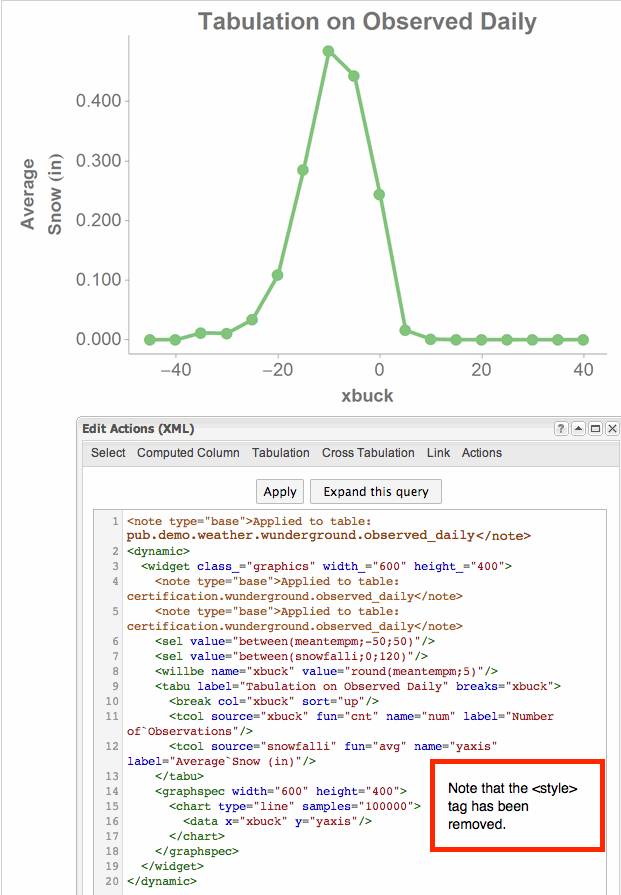
Clicking Show QuickApp... will display the QuickApp that contains the chart widget in the new QuickApp environment. We now have the first widget of our new dashboard.
If you click the Actions menu and then click Edit Actions
(XML)..., you'll see in the Macro Language code that the system has wrapped the
original query and the code for the chart in a <widget> element:
Now, let's take the code apart piece by piece:
And below is the commented code for easy copying. Again, the <style> tag
from the chart has been removed from the <chart> element.
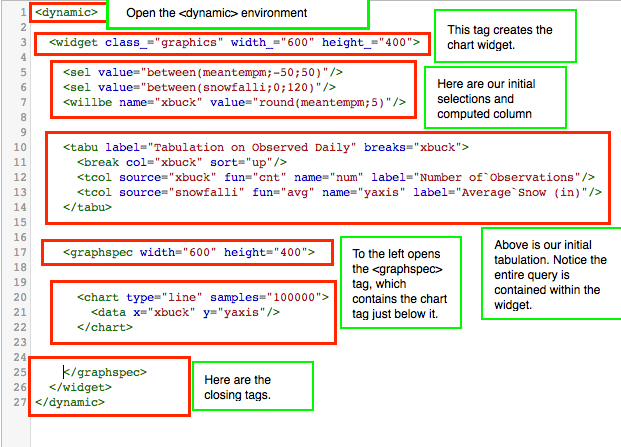
<note>First, the dynamic tag encapsulates the entire QuickApp.</note>
<dynamic>

<note> Next, the widget tag specifies the height and width of the widget. Notice
how the entire query for analysis is contained within the widget</note>

  <widget class_="graphics" width_="600" height_="400">


<note>Here's the query logic for the original analysis.</note>
    <sel value="between(meantempi;-50;50)"/>
    <sel value="between(snowfalli;0;120)"/>
    <willbe name="xbuck" value="round(meantempi;5)"/>
    <tabu label="Tabulation on Observed Daily" breaks="xbuck">
      <break col="xbuck" sort="up"/>
      <tcol source="xbuck" fun="cnt" name="num" label="Number of `Observations"/>
      <tcol source="snowfalli" fun="avg" name="yaxis" label="Average`Snow (in)"/>
    </tabu>


<note>This is the code for the chart.</note>
  <graphspec width="600" height="400">
    <chart type="line" samples="100000">
      <data x="xbuck" y="yaxis"/>
    </chart>
  </graphspec>


<note>This closes the widget, and finally the dynamic environment.</note>
  </widget>
</dynamic>
A <widget> is a single point of action in a QuickApp. There are widgets
for drop-down menus, radio buttons, check boxes, buttons, links, and text fields, along with
many others. Combining widgets that a user can interact with and widgets that display
information is what building a QuickApp is really all about. And we already have one widget
that will display information -- the chart we created in the Chart Builder. However, it would
be very helpful to change information in our analysis so we can simply click through the data
and visually see the results. To do this, we'll need to add another widget. The new widget
will be an input field, and it will add the functionality we need.
To add a new widget, click the View menu again and click QuickApp Editor... You now have a canvas for creating your custom QuickApp! You'll see the graphics widget containing your chart already on the grid.
To add a new widget, right-click anywhere on the grid to display the QuickApp Editor shortcut menu:
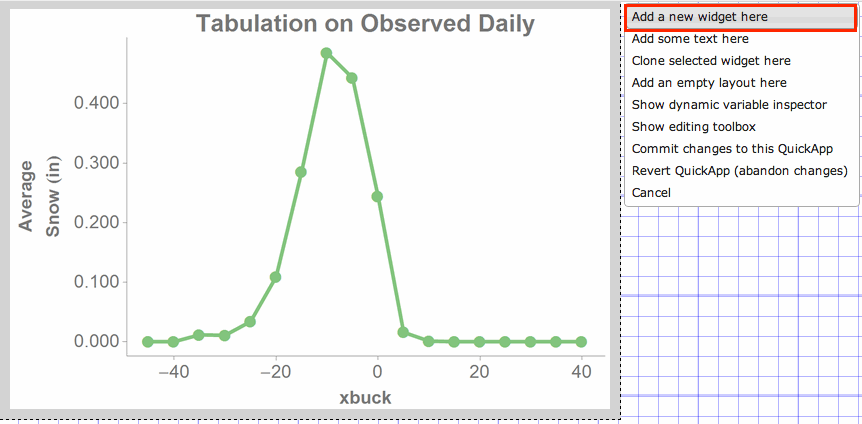
Click Add a new widget here from the shortcut menu, and a new dialog is presented that allows you to define the properties of the new widget. Here's what it looks like:
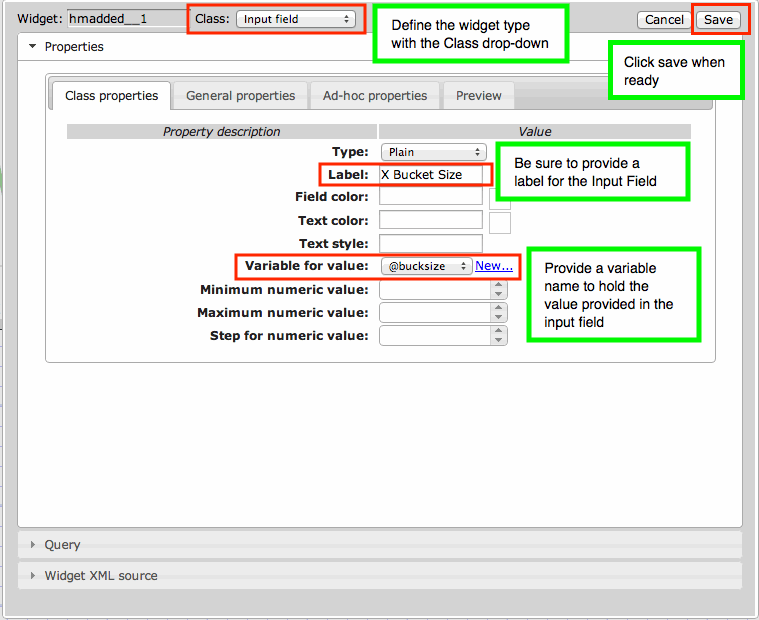
For the second widget (remember, the first widget is the chart), click Input
field from the Class drop-down menu at the top of the
dialog. We can also add a new variable to hold the value entered in the input field. Next to
the Variable for value drop-down, click the
New... link, as illustrated in the screenshot above, and
enter bucksize as the variable name.

And finally let's give this input field a label. Enter "X Bucket Size" in the Label field.
Now click the Save button to save our new widget.
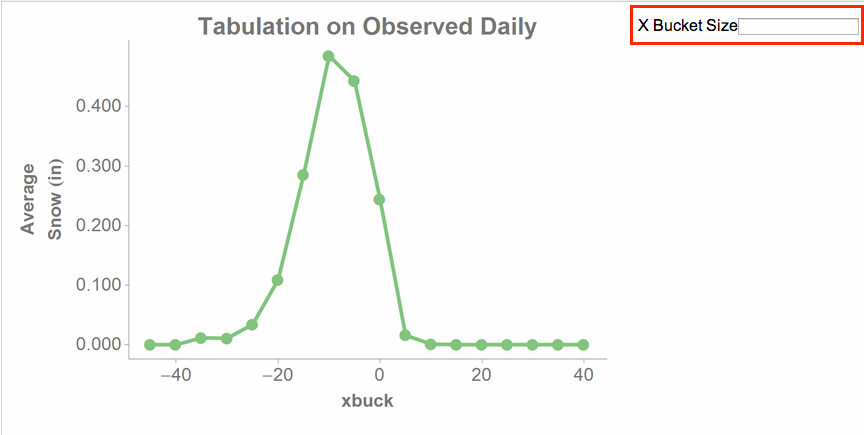
Once you're back in the QuickApp the new X Bucket Size input field will appear next to the chart, as shown below:
Now, click to see the Macro Language code, and you'll see that the new QuickApp is really
starting to take shape. Find the newly created widget in the code. The QuickApp Editor adds a
relpos attribute, which needs to be removed:

<dynamic bucksize="">
  <widget class_="graphics" height_="400" name="hmnonce__1" width_="600">

    <sel value="between(meantempi;-50;50)"/>
    <sel value="between(snowfalli;0;120)"/>
    <willbe name="xbuck" value="round(meantempi;5)"/>
    <tabu label="Tabulation on Observed Daily" breaks="xbuck">
      <break col="xbuck" sort="up"/>
      <tcol source="xbuck" fun="cnt" name="num" label="Number of`Observations"/>
      <tcol source="snowfalli" fun="avg" name="yaxis" label="Average`Snow (in)"/>
    </tabu>
    <graphspec width="600" height="400">
      <chart type="line" samples="100000">
        <data x="xbuck" y="yaxis"/>
      </chart>
    </graphspec>
  </widget>
  <widget class_="field" label_="X Bucket Size" name="hmadded__1" value_="@bucksize"/>
</dynamic>bucksize="" variable in
the <dynamic> tag. Then, replace the hardcoded value in the
<willbe> that calculates the bucket size with a reference to the scalar
value held in the variable. The updated code, with the differences from above in bold, is
below:<dynamic bucksize="5">
<widget class_="graphics" height_="400" name="hmnonce__1" width_="600">
<sel value="between(meantempi;-50;50)"/>
<sel value="between(snowfalli;0;120)"/>
<willbe name="xbuck" value="round(meantempi;{@bucksize})"/>
<tabu label="Tabulation on Observed Daily" breaks="xbuck">
<break col="xbuck" sort="up"/>
<tcol source="xbuck" fun="cnt" name="num" label="Number of`Observations"/>
<tcol source="snowfalli" fun="avg" name="yaxis" label="Average`Snow (in)"/>
</tabu>
<graphspec width="600" height="400">
<chart type="line" samples="100000">
<data x="xbuck" y="yaxis"/>
</chart>
</graphspec>
</widget>
<widget class_="field" label_="X Bucket Size" name="hmadded__1" value_="@bucksize"/>
</dynamic>Now, whatever value we enter in the X Bucket Size input field will be reflected in the chart.
We're well on our way to producing our first dashboard QuickApp. In the next section, we'll add query logic that will populate our widgets, as well as add some additional functionality.