Cloning a Widget
Once you've laid some basic groundwork, adding widgets gets a lot easier. We've already parameterized our x-axis so that we can view different metrics in our graph. It would make sense to do the same for the y-axis as well. We can do this very easily by simply cloning the widgets we created for the x-axis!
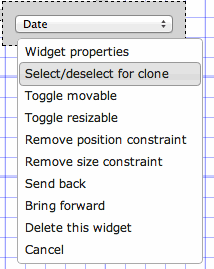
Click . To clone a widget, right-click on the widget you want to clone and click Select/deselect for clone:

Then, right-click where you want to place the newly cloned widget and click Clone selected widget here.
snowfalli to the yaxis
variable so that the chart will dynamically update when that variable is changed.<dynamic bucksize="5" xaxis="meantempi" xmin="-50" xmax="50" yaxis="snowfalli" ymin="0" ymax="120">
<widget class_="graphics" height_="400" name="hmnonce__1" width_="600">
<sel value="between({@xaxis};{@xmin};{@xmax})"/>
<sel value="between({@yaxis};{@ymin};{@ymax})"/>
<willbe name="xbuck" value="round({@xaxis};{@bucksize})"/>
<tabu label="Tabulation on Observed Daily" breaks="xbuck">
<break col="xbuck" sort="up"/>
<tcol source="xbuck" fun="cnt" name="num" label="Number of`Observations"/>
<tcol source="{@yaxis}" fun="avg" name="yaxis" label="Average`Snow (in)"/>
</tabu>
<graphspec width="600" height="400">
<chart type="line" samples="100000">
<data x="xbuck" y="yaxis"/>
</chart>
</graphspec>
</widget>
<widget class_="field" label_="X Bucket Size" name="hmadded__1" value_="@bucksize"/>
<widget base_="pub.demo.weather.wunderground.observed_daily" class_="dropdown" label_="X Variable" name="hmadded__2">
<columns full="0"/>
<sel value="(type='f''i')"/>
<colord cols="name,label"/>
</widget>
<widget base_="pub.demo.weather.wunderground.observed_daily" class_="dropdown" label_="Y Variable" name="hmadded__3" value_="@yaxis">
<columns full="0"/>
<sel value="(type='f''i')"/>
<colord cols="name,label"/>
</widget>
<widget class_="field" label_="X Min:" value_="@xmin"/>
<widget class_="field" label_="X Max:" value_="@xmax"/>
<widget class_="field" label_="Y Min:" value_="@ymin"/>
<widget class_="field" label_="Y Max:" value_="@ymax"/>
</dynamic>
repos attributes
from the new Y widgets. This will be important for the next section of this
tutorial.Now our QuickApp has the ability to take many potential values for both the x-axis and y-axis
of the chart. However, you may have had a little difficulty getting everything to line up the
way you wanted. In the next section, we'll look at the <layout> element
and how it can help us to arrange the widgets of our QuickApp in a more aesthetically pleasing
way.
