Controlling When Widgets Are Updated
It is incredibly important to control exactly when your QuickApp tells its associated queries to re-run. In this section, we'll look at exactly how to do just that.
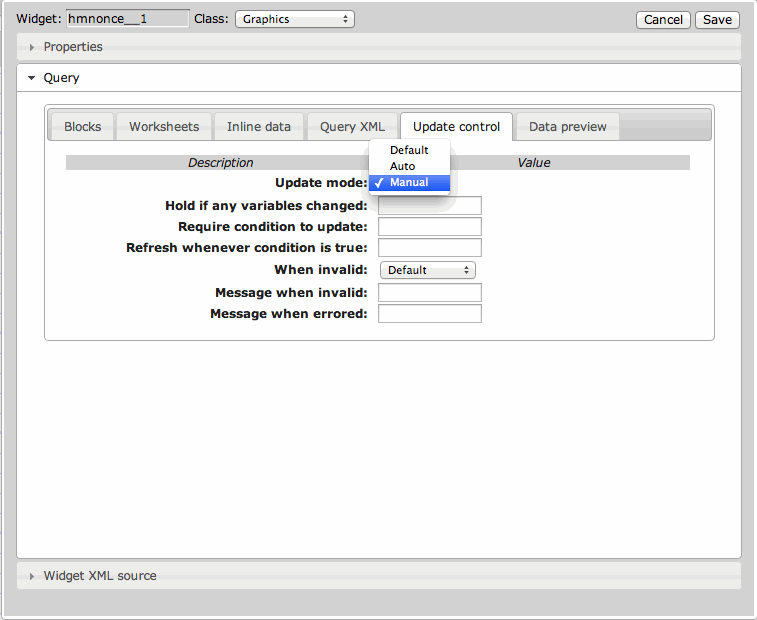
- Default - Adopts the update mode set in the
<dynamic>element for the widget. - Auto - Sets the widget to auto update mode regardless of the
<dynamic>update mode. - Manual - Sets the widget to manual update mode regardless of the
<dynamic>update mode.
We want the user to control when the graph is updated, so in the Update mode drop-down, click Manual.

Click Save to save the changes to the widget.
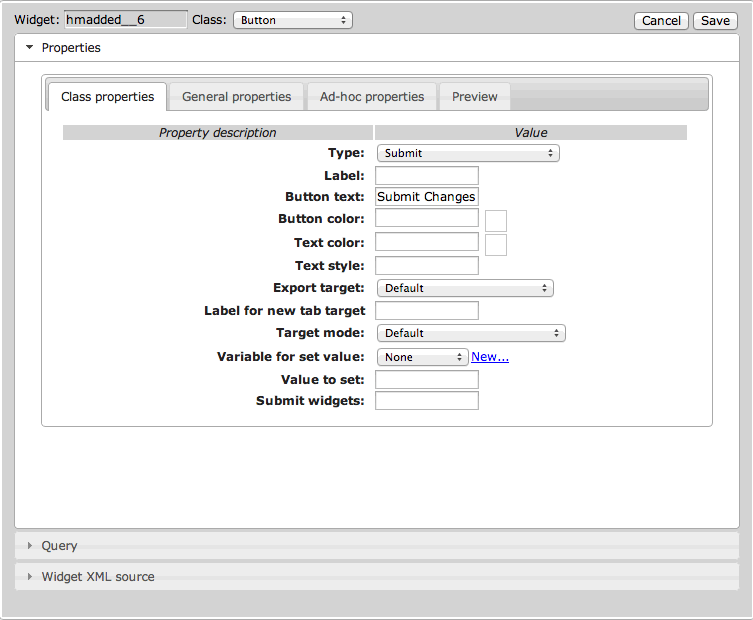
Next, we'll add a button widget that will let the user decide when to submit the changes and view the new results. In the QuickApp Editor, right-click where you want to place the button and click Add a new widget here. From the Class drop-down, click Button, and from the Type drop-down under the Class properties tab, click Submit, as shown below. Also, in the Button text field, enter "Submit Changes."

Click the Save button and commit the changes to the QuickApp. Open the
Edit Actions (XML) dialog to view the code. You'll notice that the new
button widget has been placed outside of the last <layout> element. Cut
and paste it inside the last <layout> tag. You should also notice that the
graphics widget now has an update_="manual"
attribute/value pair. This will allow the end-user to trigger when the graph updates by
clicking the Submit Changes button. The code is shown below with the
new additions in bold:
<dynamic bucksize="5" xaxis="meantempi" xmin="-50" xmax="50" yaxis="snowfalli" ymin="0" ymax="120">
  <widget class_="graphics" name="hmnonce__1" update_="manual">
    <sel value="between({@xaxis};{@xmin};{@xmax})"/>
    <sel value="between(snowfalli;0;120)"/>
    <willbe name="xbuck" value="round({@xaxis};{@bucksize})"/>
    <tabu label="Tabulation on Observed Daily" breaks="xbuck">
      <break col="xbuck" sort="up"/>
      <tcol source="xbuck" fun="cnt" name="num" label="Number of`Observations"/>
      <tcol source="{@yaxis}" fun="avg" name="yaxis" label="Average`Snow (in)"/>
    </tabu>
    <graphspec width="600" height="400">
      <chart type="line" samples="100000">
        <data x="xbuck" y="yaxis"/>
        <legend hide="1"/>
      </chart>
      <style linemarkershow="0"/>
    </graphspec>
  </widget>
  <layout name="hmnonce_1">
    <layout name="hmnonce_1_1">
      <widget base_="pub.demo.weather.wunderground.observed_daily" class_="dropdown" label_="X Variable:" name="hmnonce_1_1__1" value_="@xaxis">
        <columns full="0"/>
        <sel value="(type='f''i')"/>
        <colord cols="name,label"/>
      </widget>
      <widget class_="field" label_="X Min:" name="hmnonce_1_1__2" value_="@xmin"/>
      <widget class_="field" label_="X Max:" name="hmnonce_1_1__3" value_="@xmax"/>
      <widget class_="field" label_="X Bucket Size:" name="hmnonce_1_1__4" value_="@bucksize"/>
    </layout>
    <layout name="hmnonce_1_2">
      <widget base_="pub.demo.weather.wunderground.observed_daily" class_="dropdown" label_="Y Variable:" name="hmnonce_1_2__1" value_="@yaxis">
        <columns full="0"/>
        <sel value="(type='f''i')"/>
        <colord cols="name,label"/>
      </widget>
      <widget class_="field" label_="Y Min:" name="hmnonce_1_2__2" value_="@ymin"/>
      <widget class_="field" label_="Y Max:" name="hmnonce_1_2__3" value_="@ymax"/>
    </layout>
    <widget class_="button" name="hmadded__1" text_="Submit Changes" type_="submit"/>
  </layout>
</dynamic>
The button now appears just below our input fields:

With the Submit Changes button in place, the chart will not update, no
matter how many changes are made to the input fields, until the end user clicks the button.
Play around with the inputs and make sure your code works. When it does, move on to the next
section, where we will work with the <do> element to automatically trigger
events and make changes to the QuickApp while preserving the user's ability to control
updates.
