Using the <layout> Element
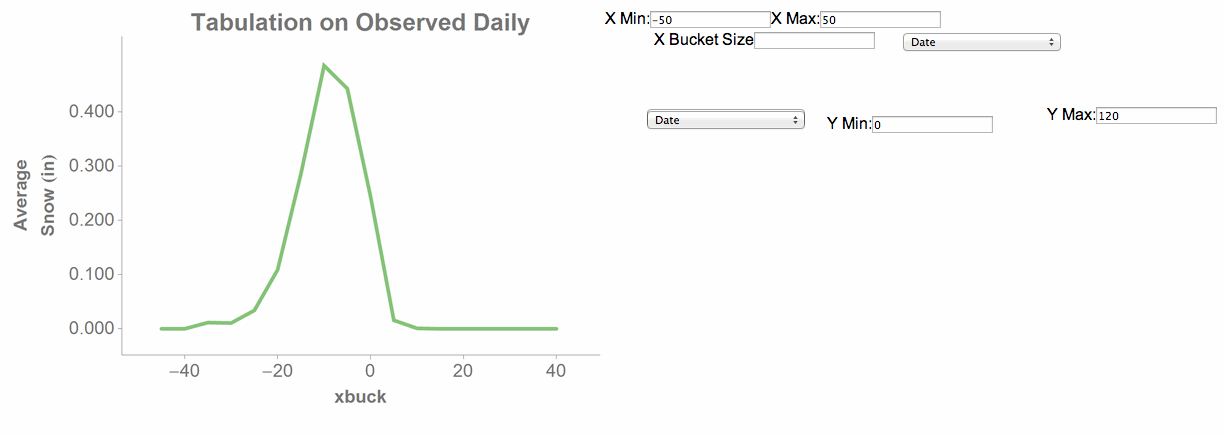
If you've been following along, you may have noticed it's been difficult to get the input widgets to line up nicely. In fact, here's what the example currently looks like:

While the input fields may work, they may not look so nice. Fortunately, QuickApps provide a
tool that can help. The <layout> element has built-in abilities to
properly and cleanly order your widgets. The <layout> element will
automatically adjust the positioning of widgets, alternating between horizontal and vertical
orientation with each nested <layout> element. However, you must make sure
that none of your widgets contain the relpos attribute, as this attribute
overrides the automatic positioning that <layout> provides. This is
intentional. Each method provides a different way to control the positioning of your widgets.
But for the example in this tutorial, we will use <layout>.
Since we're happy with the position of the graph, we don't need to place it in a layout.
However, let's help the input fields a little. Before we use the <layout>
tag to position the elements, let's group the widgets in a more logical way. We'll place the
three X Axis widgets in order, followed by the Y
Axis widgets, so that after they're positioned they'll appear next to each
other. This can be done with a couple simple cut and paste maneuvers:
<dynamic bucksize="5" xaxis="meantempi" xmin="-50" xmax="50" yaxis="snowfalli" ymin="0" ymax="120">
  <widget class_="graphics" height_="400" name="hmnonce__1" width_="600">
    <sel value="between({@xaxis};{@xmin};{@xmax})"/>
    <sel value="between({@yaxis};{@ymin};{@ymax})"/>
    <willbe name="xbuck" value="round({@xaxis};{@bucksize})"/>
    <tabu label="Tabulation on Observed Daily" breaks="xbuck">
      <break col="xbuck" sort="up"/>
      <tcol source="xbuck" fun="cnt" name="num" label="Number of`Observations"/>
      <tcol source="{@yaxis}" fun="avg" name="yaxis" label="Average`Snow (in)"/>
    </tabu>
    <graphspec width="600" height="400">
      <chart type="line" samples="100000">
        <data x="xbuck" y="yaxis"/>
      </chart>
    </graphspec>
  </widget>


  <note>The chart widget and bucket widget can remain where they are</note>
  <widget class_="field" label_="X Bucket Size" name="hmadded__1" value_="@bucksize"/>

      <note>Group the X Axis Widgets</note>
  <widget base_="pub.demo.weather.wunderground.observed_daily" class_="dropdown" label_="X Variable" name="hmadded__2" value_="@xaxis">
        <columns full="0"/>
        <sel value="(type='f''i')"/>
        <colord cols="name,label"/>
      </widget>
  <widget class_="field" label_="X Min:" value_="@xmin"/>
  <widget class_="field" label_="X Max:" value_="@xmax"/>


  <note>Then group the Y Axis Widgets together as follows</note>

  <widget base_="pub.demo.weather.wunderground.observed_daily" class_="dropdown" label_="Y Variable" name="hmadded__3" value_="@yaxis">
        <columns full="0"/>
        <sel value="(type='f''i')"/>
        <colord cols="name,label"/>
  </widget>
  <widget class_="field" label_="Y Min:" value_="@ymin"/>
  <widget class_="field" label_="Y Max:" value_="@ymax"/>
</dynamic>
Place the first <layout> tag around all the x-axis and y-axis widgets.
Then, place the bucksize widget in its own <layout>
element, place the x-axis widgets in another <layout> element, and
finally, do the same for the y-axis widgets.
When you're done, the code will look something like this:
<dynamic bucksize="5" xaxis="meantempi" xmin="-50" xmax="50" yaxis="snowfalli" ymin="0" ymax="120">
  <widget class_="graphics" height_="400" name="hmnonce__1" width_="600">
    <sel value="between({@xaxis};{@xmin};{@xmax})"/>
    <sel value="between({@yaxis};{@ymin};{@ymax})"/>
    <willbe name="xbuck" value="round({@xaxis};{@bucksize})"/>
    <tabu label="Tabulation on Observed Daily" breaks="xbuck">
      <break col="xbuck" sort="up"/>
      <tcol source="xbuck" fun="cnt" name="num" label="Number of`Observations"/>
      <tcol source="{@yaxis}" fun="avg" name="yaxis" label="Average`Snow (in)"/>
    </tabu>
    <graphspec width="600" height="400">
      <chart type="line" samples="100000">
        <data x="xbuck" y="yaxis"/>
      </chart>
    </graphspec>
  </widget>


  <note>Here we open  the first <layout> tag, which will encapsulate the other widgets and layouts</note>
  <layout>

    <note>This <layout> encapsulates the bucket input field, and is in turn encapsulated by the outer-most layout</note>
    <layout>
      <widget class_="field" label_="X Bucket Size" name="hmadded__1" value_="@bucksize"/>
    </layout>


    <note>This layout encapsulates the X Axis widgets. These widgets and their encasing layout are contained by the outer-most layout</note>
    <layout>
      <widget base_="pub.demo.weather.wunderground.observed_daily" class_="dropdown" label_="X Variable" name="hmadded__2" value_="@xaxis">
        <columns full="0"/>
        <sel value="(type='f''i')"/>
        <colord cols="name,label"/>
      </widget>
      <widget class_="field" label_="X Min:" value_="@xmin"/>
      <widget class_="field" label_="X Max:" value_="@xmax"/>
    </layout>


    <note>This <layout> encapsulates the Y Axis widgets. These widgets and their encasing layout are contained by the outer-most layout</note>
    <layout>
      <widget base_="pub.demo.weather.wunderground.observed_daily" class_="dropdown" label_="Y Variable" name="hmadded__3" value_="@yaxis">
        <columns full="0"/>
        <sel value="(type='f''i')"/>
        <colord cols="name,label"/>
      </widget>
      <widget class_="field" label_="Y Min:" value_="@ymin"/>
      <widget class_="field" label_="Y Max:" value_="@ymax"/>
    </layout>


    <note>Finally, we close the outer-most layout</note>
  </layout>


</dynamic>
Click Apply in the Edit Actions (XML) dialog to apply the changes.
The result we get is much cleaner:

As you can see, our input fields are in a much better arrangement than when we started.
Everything is really taking shape. But we haven't actually changed any of the variables or
seen the QuickApp in action yet. One of the most important aspects to pay attention to when
building a new QuickApp is how and when the widgets are updated based on when the values of
variables defined in a <dynamic> environment change. Remember, this all
started with a query. By parameterizing the values we used in the query, we are giving our
QuickApp the ability to re-run the query when a change to those values is made. But do we want
it to re-run the query after one value is changed? Or all of them? Or do we want the user to
decide?
In the next section, we'll explore how to control the QuickApp widgets so they update only when we want them to.
