
g_cdf(G;S;O;X)
Returns the cumulative frequency distribution of values within a given group.
Function type
Vector only
Syntax
g_cdf(G;S;O;X)
t_cdf(X)
Input
| Argument | Type | Description |
|---|---|---|
G |
any | A space- or comma-separated list of column names Rows are in the same group
if their values for all of the columns listed in If If any of the columns listed in |
S |
integer | The name of a column in which every row evaluates to a 1 or 0, which determines
whether or not that row is selected to be included in the calculation If
If any of the values in
|
O |
integer or decimal | A space- or comma-separated list of column names that
determine the row order within a particular group Note: The
O parameter has no effect and may be omitted. |
X |
any numeric type | A column name |
Return Value
For every row in each group defined by G (and for those rows where
S=1, if specified), g_cdf returns
a decimal value corresponding to the fraction of valid (non-N/A) values of
X within the group that are less than or equal to the current value of
X.
g_cdf(G;S;O;X) is equivalent to
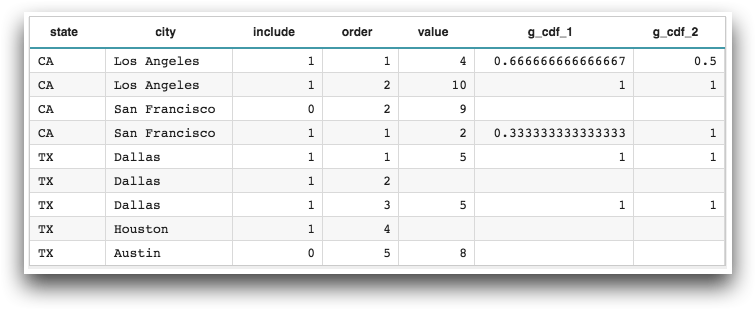
g_cumfreq(G;S;O;X)/g_valcnt(G;S;X).Sample Usage
<base table="pub.doc.samples.ref.func.g_func_time_series_sample_usage"/>
<willbe name="g_cdf_1" value="g_cdf(state;include;order;value)"/>
<willbe name="g_cdf_2" value="g_cdf(state city;include;order;value)"/>
Example
Let's use the Hourly U.S. Weather (1990) table
(pub.demo.weather.hourly90) to demonstrate the use of
g_cdf(G;S;O;X).
Let's say we want to find out, for every hour of a particular day, the percentage of hours of the day that it rained as much or less.
For demonstration purposes, let's select one particular day at one particular station, and we'll display only those columns that are relevant to this example.
<base table="pub.demo.weather.hourly90"/>
<sel value="(date=19900224)"/>
<sel value="(id=25339)"/>
<colord cols="id,date,hour,prec"/>
This will give us the following:
prec is the hourly precipitation measured in .01 inches.Let's create a computed column for the results of g_cdf(G;S;O;X). Since
we've already selected the rows that we want for our group, we can omit the
G parameter. We'll also omit the S parameter, since we
want to consider all rows in this group. We can also omit the O parameter
since it has no effect for this function. Finally, we'll specify the prec
column for X since we want to calculate the cumulative frequency
distribution of precipitation.
<willbe name="cumfreq_amt" value="g_cdf(;;;prec)" format="type:pct;dec:2"/>
format="type:pct;dec:2" so that the results will be
displayed as a percentage with two decimal places of precision.This will give us the following:
This new column shows, for example, that at 10 a.m. on 2/24/90, it rained .12 inches, and that 45.83% of the hours in that day it rained that much or less.
Additional Information
- The
t_version of this function defaults theGargument and omits theSandOarguments. The default forGis set at table load time based on the organization of the table.