
g_outlier(G;S;X;Z)
Returns a numeric value indicating outliers or extreme values. (Available as of version 10.44)
Function type
Vector only
Syntax
g_outlier(G;S;X;Z)Input
| Argument | Type | Description |
|---|---|---|
G |
any | A space- or comma-separated list of column names Rows are in the same group
if their values for all of the columns listed in If If any of the columns listed in |
S |
integer | The name of a column in which every row evaluates to a 1 or 0, which determines
whether or not that row is selected to be included in the calculation If
If any of the values in
|
X |
any numeric type | A column name The column on which to apply the outlier algorithm. |
Z |
text or package | A string of pairs of option names and option values, or a package that
specifies these values (optional) The options you may specify for the
The following option can also be specified when using the
'tukeys' method:
The following options can also be specified when using the
'gesd' method:
For example, since Z can either consist of a string of
name/value pairs or a package, the same values can be specified for
Z in either of the following forms:
If |
Return Value
For every row in each group defined by G (and for those rows where
S=1, if specified),
g_outlier(G;S;X;Z) applies an outlier algorithm specified in
Z to the data in X.
-
If Tukey's method is selected, it returns a boolean value labeling outliers with a
1and non-outliers with a0.Tukey’s method (Tukey 1977), which does not assume a distribution and is sometimes called the boxplot method, computes upper and lower fences to determine outliers. If
Xvalues are less than the lower fence or greater than the upper fence, the return value is 1; otherwise, it is 0. As the optionfence_multincreases, the distance between the lower fence and upper fence increases. -
If the GESD method is selected, it returns
0for each row that is not an outlier and a ranking of the outliers otherwise (i.e.,1is the most extreme outlier,2is the second most extreme outlier, etc.).GESD, which assumes approximate normality of the data, iteratively computes
max_numseparate tests for outliers based on Rosner’s (Rosner 1983) generalization of Grubbs’s test (Grubbs 1950). The return value for GESD provides a ranking for outliers: 0 for non-outliers, and NA for rows with NA or values for whichS=0.
Example
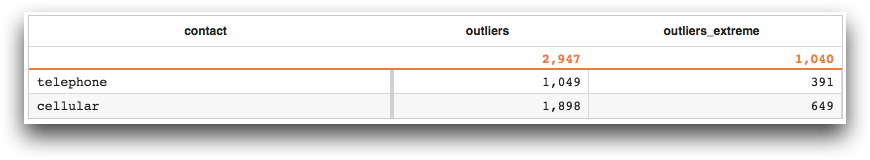
The following example uses g_outlier(G;S;X;Z) to determine the outliers in
the duration column of the
pub.demo.mleg.uci.bankmarketing table, grouped by the values in the
contact column. The first instance of g_outlier(G;S;X;Z)
uses Tukey's method with a fence multiplier of 1.5, as specified by the Z
parameter. This determines the outliers when the default fence multiplier is used. The
second instance of g_outlier(G;S;X;Z) sets the fence multiplier to 3.0,
which determines the more extreme outliers. A tabulation is then performed, which produces
the total number of both the default outliers and extreme outliers for each group in the
contact column.
<base table="pub.demo.mleg.uci.bankmarketing"/>
<willbe name="outs"
 value="g_outlier(contact;;duration;pkg('method' 'fence_mult';'tukeys' 1.5))"/>
<willbe name="outs_extreme"
 value="g_outlier(contact;;duration;pkg('method' 'fence_mult';'tukeys' 3.0))"/>
<tabu breaks="contact" label="Tabulation">
  <tcol fun="sum" name="outliers" source="outs" label="Number of`Outliers"/>
  <tcol fun="sum" name="outliers_extreme" source="outs_extreme"
   label="Number of Extreme`Outliers"/>
</tabu>
References
- Tukey, John. 1977. Exploratory Data Analysis. Addison-Wesley.
- Rosner, Bernard. 1983. "Percentage Points for a Generalized ESD Many-Outlier Procedure." Technometrics 25(2):165-172.
- Grubbs, Frank. 1950. "Sample Criteria for Testing Outlying Observations." Annals of Mathematical Statistics 21(1):27-58.