
g_quantile(G;S;X;P)
Returns the quantile for values within a given group.
Function type
Vector only
Syntax
g_quantile(G;S;X;P)
t_quantile(X;P)
Input
| Argument | Type | Description |
|---|---|---|
G |
any | A space- or comma-separated list of column names Rows are in the same group
if their values for all of the columns listed in If If any of the columns listed in |
S |
integer | The name of a column in which every row evaluates to a 1 or 0, which determines
whether or not that row is selected to be included in the calculation If
If any of the values in
|
X |
any numeric type | A column name |
P |
integer or decimal | A column name or an expression evaluating to a numeric value that represents a probability for each row of the table |
Return Value
For every row in each group defined by G (and for those rows where
S=1, if specified), g_quantile
returns a numeric value corresponding to the smallest value of X such that
random draws from the valid (non-N/A) values of X within the group would be
less than or equal to X with a probability no greater than
P. The result is the same data type as X.
For example, g_quantile(G;S;X;0.5) is the (lower) median of
X.
Sample Usage
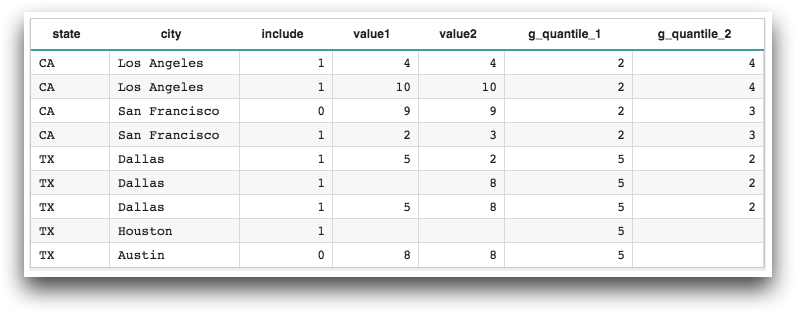
<base table="pub.doc.samples.ref.func.g_func_sample_usage_two_values"/>
<willbe name="g_quantile_1" value="g_quantile(state;include;value1;0.25)"/>
<willbe name="g_quantile_2" value="g_quantile(state city;include;value2;0.25)"/>
Example
Let's use the Hourly U.S. Weather (1990) table
(pub.demo.weather.hourly90) to demonstrate the use of
g_quantile(G;S;X;P).
Let's say we want to find the 0.25 quantile with respect to hourly precipitation for a particular day. In other words, we want to find the smallest value of hourly precipitation such that it and all values lower than it constitute 25% of the values within the group.
<sel value="(date=19900224)"/>
<sel value="(id=25339)"/>
<colord cols="id,date,hour,prec"/>
This will give us the following:
prec is the hourly precipitation measured in .01 inches.g_quantile(G;S;X;P).
Since we've already selected the rows that we want for our group, we can omit the
G parameter. We'll also omit the S parameter, since we
want to consider all rows in this group. We'll specify the prec column for
X, since we want to find the quantile with respect to hourly
precipitation, and we'll specify .25 for the P parameter so that we obtain
the 0.25
quantile.<willbe name="quantile" value="g_quantile(;;prec;0.25)"/>This will give us the following:
This new column shows that 25% of the values in the group are less than or equal to 9. So, for the 24 hours that we have selected in this group, 6 had .09 inches or less of rain that day.
prec column in descending order and look at the lowest 6
values, we can see that they all have values of 9 or
less:<sort col="prec" dir="down"/>
Additional Information
- The
t_version of this function defaults theGargument and omits theSargument. The default forGis set at table load time based on the organization of the table.