Adding a button to run the queries
We want to be able to run our queries by simply clicking a button on the dashboard.
Click on the Dashboard tab. Let's add the button somewhere around cell B18 on that worksheet:
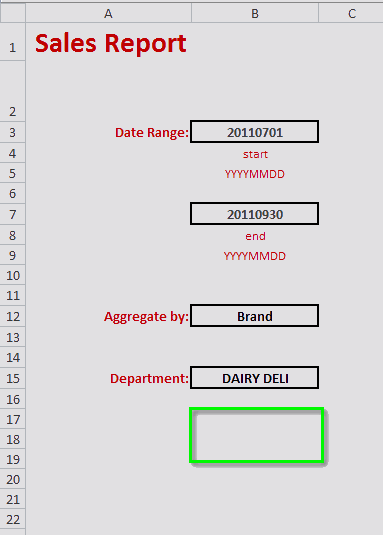
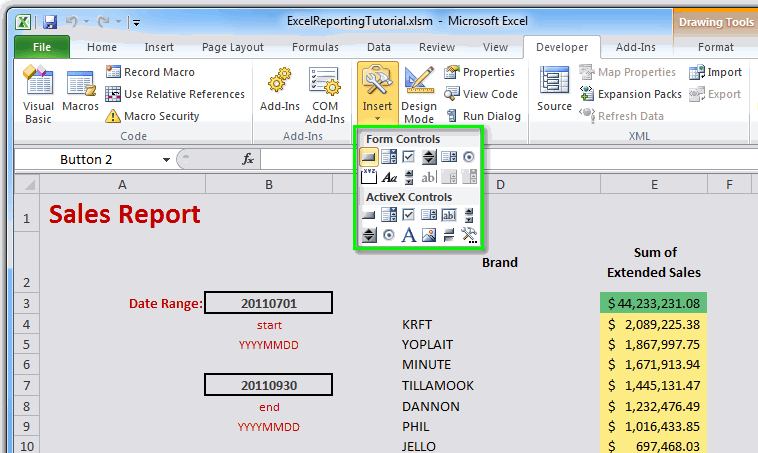
On the dashboard, drag across the area where you want the button to appear.
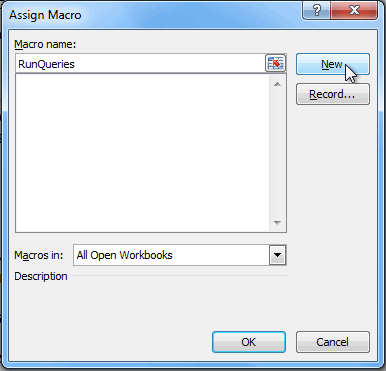
In the Assign Macro dialog, enter "RunQueries" for the Macro name and then click the New button:
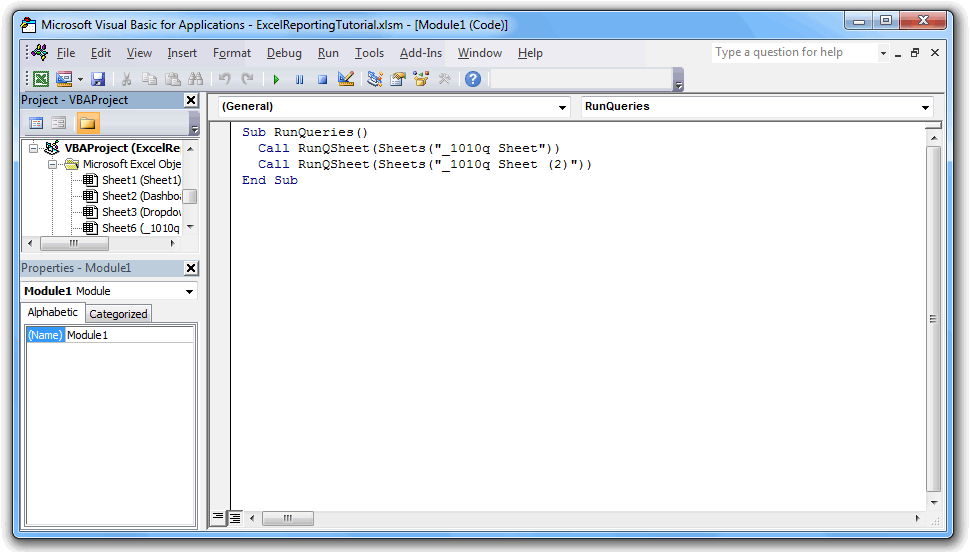
This will bring up the Microsoft Visual Basic for Applications window,
which will allow us to execute the RunQueries macro when our new button is
clicked. Enter the following code:
Sub RunQueries()
  Call RunQSheet (Sheets("_1010q Sheet"))
  Call RunQSheet (Sheets("_1010q Sheet (2)"))
End Sub
The 1010data Excel Add-in VBA function RunQSheet validates and runs the two
specified q-sheets, Sheets("_1010q Sheet") and Sheets("_1010q Sheet
(2)").
Quiet:=True to the RunQSheet
function calls. For example, Call RunQSheet (Sheets("_1010q Sheet"),
Quiet:=True)Let's make sure our VBA project has a reference to the 1010data Excel Add-in VBA library. In the Microsoft Visual Basic for Applications window, click and select A1010data from the list of Available References, if it is not already selected.
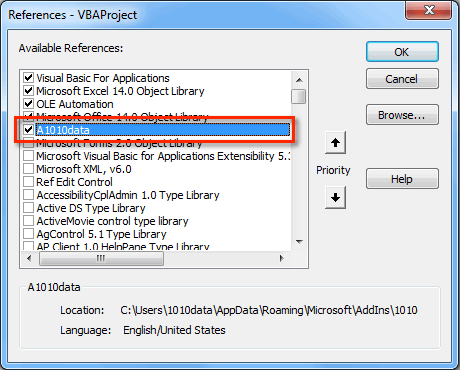
Click OK, then save the macro by pressing Ctrl+S.
After you close the Microsoft Visual Basic for Applications window, you should see the new button on the dashboard:
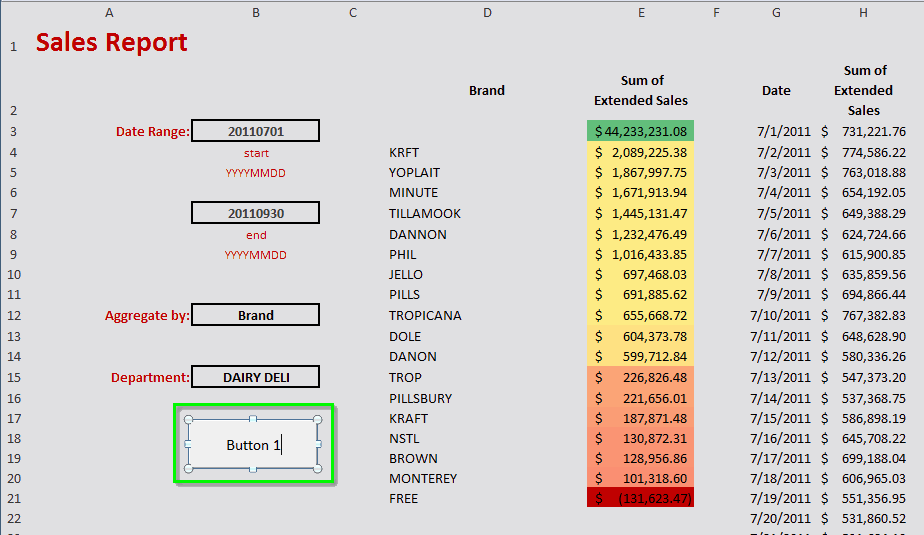
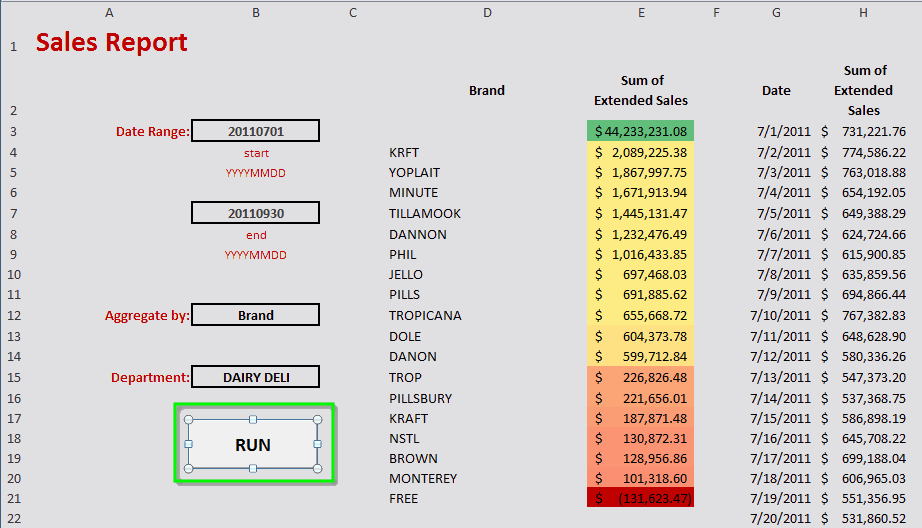
Change the text of the button to "RUN" and change the font size and style as you like. When you're done, right-click the new button and click Exit Edit Text from the context menu.
When the queries complete, we can see the results on the dashboard.
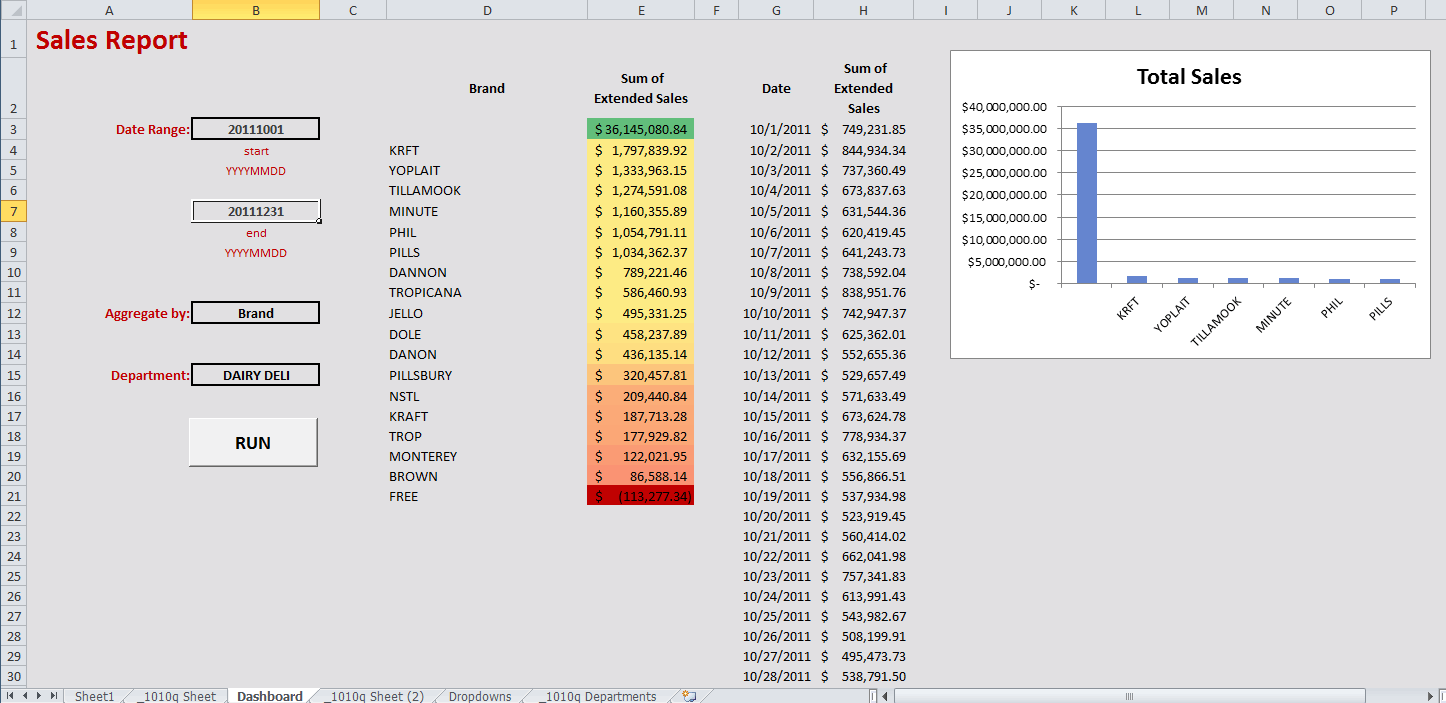
You will notice that the chart has also been updated. However, it only shows the top seven items returned from our first query. Let's modify the chart so that it will dynamically include all of the items returned from the first query. We'll also add a second chart that shows the results of the query that aggregates total sales by date.
