
Adding another query to the dashboard
We now want to aggregate the total sales by date for the same department and date range, and display those results in our dashboard.
- Determine where on the dashboard we want our results to go
- Create a new q-sheet for our new query and target the results to the dashboard
Determine the result destination on the dashboard
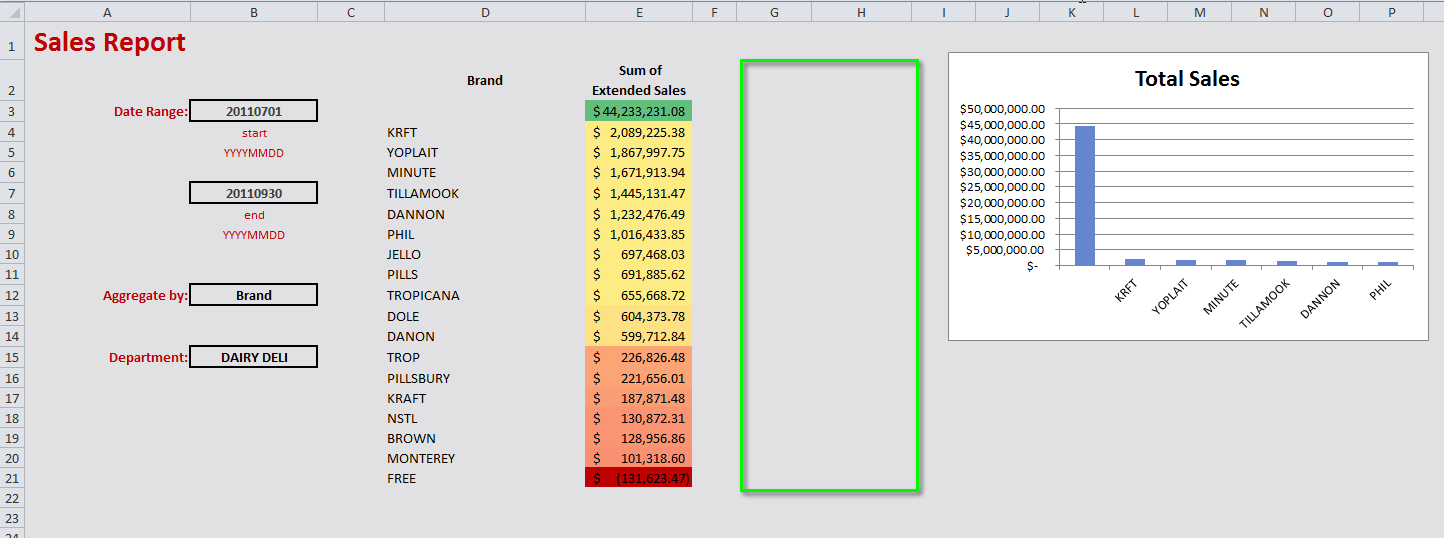
First let's figure out where we want our results to go. If we look at our dashboard, we can put our results right next to the other aggregation if we move our chart over to the right a bit:
Let's create a defined name for where the results of our query will be placed. On the Formulas tab, click Define Name. In the New Name dialog, enter query_2_results for the Name and enter the following for Refers to: =Dashboard!$G$2, then click OK.
Create a new q-sheet
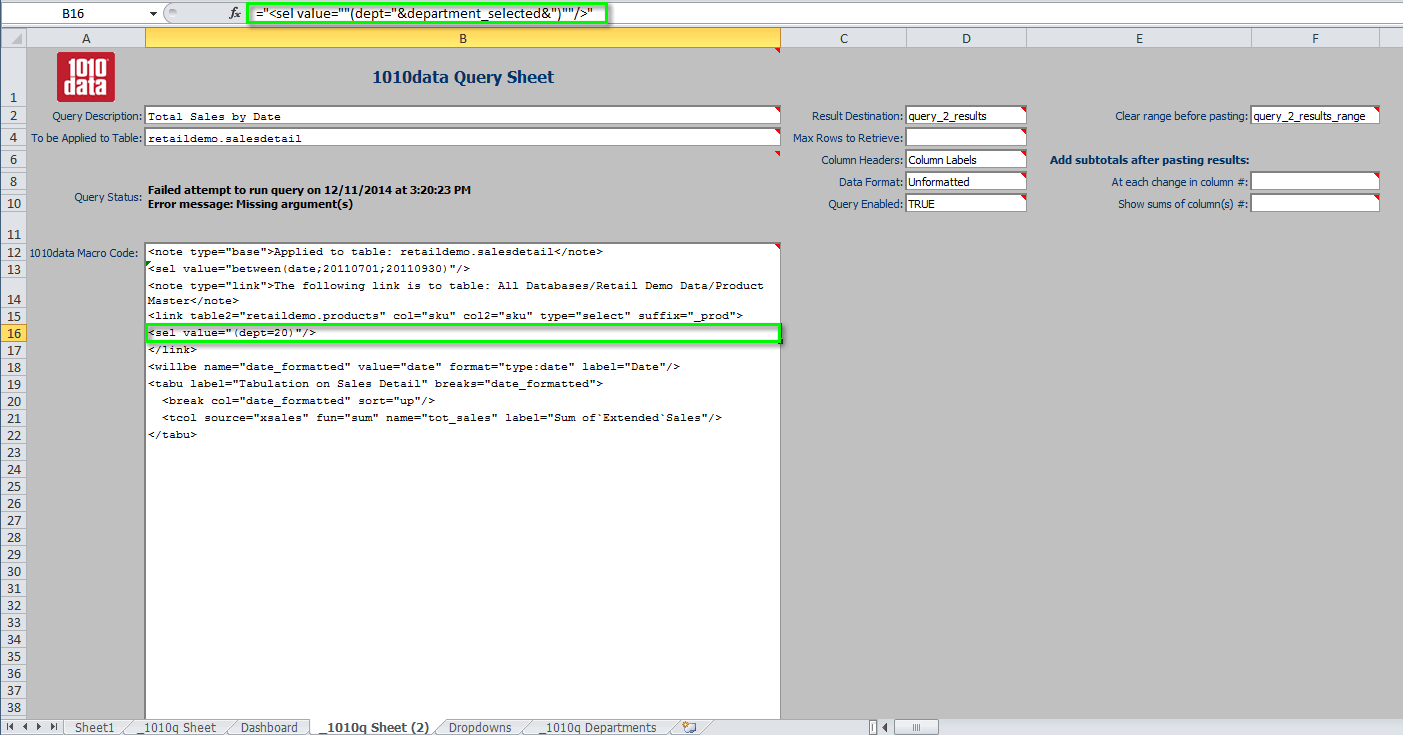
Now let's create a new q-sheet for the query we want to run on 1010data. From the menu, click . This will open a q-sheet in a new tab labeled _1010q Sheet (2).
- For the Query Description, enter "Total Sales by Date".
- In the To be Applied to Table field, enter retaildemo.salesdetail, since we want this query to be applied to the same table as our first query.
- In the Result Destination field, enter query_2_results so that the results will be placed where we decided on our dashboard.
- From the Column Headers drop-down, select "Column Labels".
- In the Clear range before pasting field, we'll enter: query_2_results_range.
<ignore type="base">Applied to table: retaildemo.salesdetail</ignore>
="<sel value=""between(date;"&startdate&";"&enddate&")""/>"
<ignore type="link">The following link is to table: All Databases/Retail Demo Data/Product Master</ignore>
<link table2="retaildemo.products" col="sku" col2="sku" type="select" suffix="_prod">
="<sel value=""(dept="&department_selected&")""/>"
</link>
<willbe name="date_formatted" value="date" format="type:date" label="Date"/>
<tabu label="Tabulation on Sales Detail" breaks="date_formatted">
  <break col="date_formatted" sort="up"/>
  <tcol source="xsales" fun="sum" name="tot_sales" label="Sum of`Extended`Sales"/>
</tabu>
Our new q-sheet should look similar to the following:
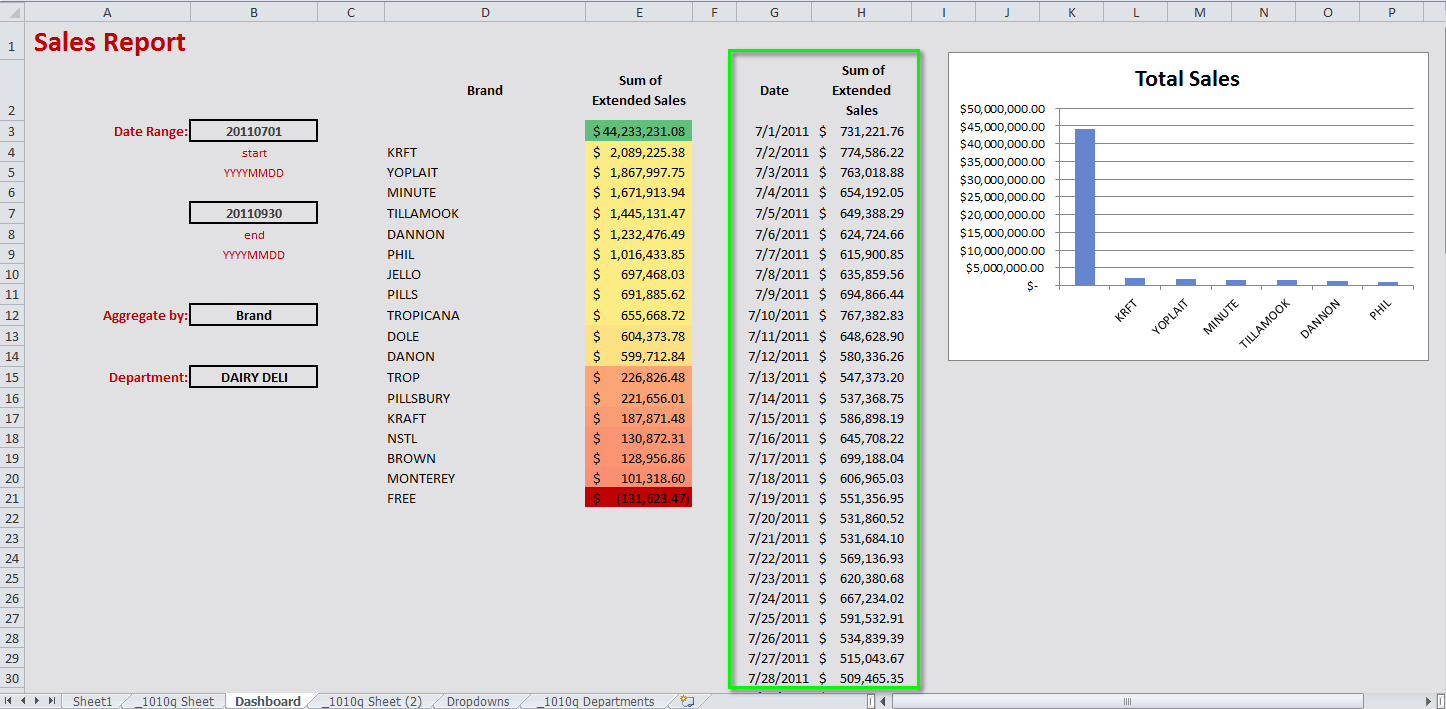
Now let's test this out. Click (or press Ctrl+Q).
You can see the results from both queries next to one another in the dashboard:
It would be even more convenient if we could run the queries directly from our dashboard. The next step will show how to add a button to the dashboard that will allow you to do just that.