Chart data
Depending on the chart selected in the chart type drop-down list, one or more chart data sections appear.
In the figure below, the red box outlines the X-AXIS, Y-AXIS, and Y-AXIS2 sections. These sections are available for plotting the selected Line chart type and indicate how that data is plotted.
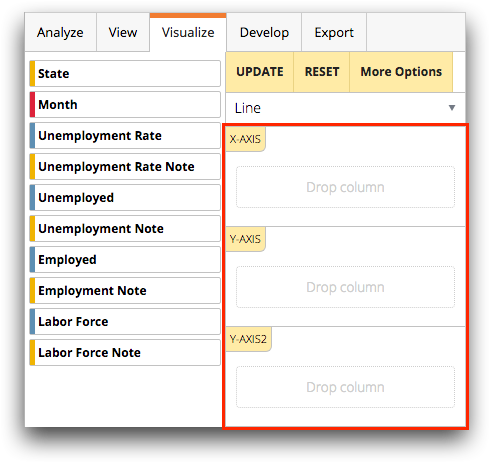
Depending on the selected chart type, different sections are displayed. For example, a line chart has areas for X-AXIS and Y-AXIS while a bar chart has areas for LABELS and BARS. The Drop column area in each chart data section displays the data required to plot the selected chart type.
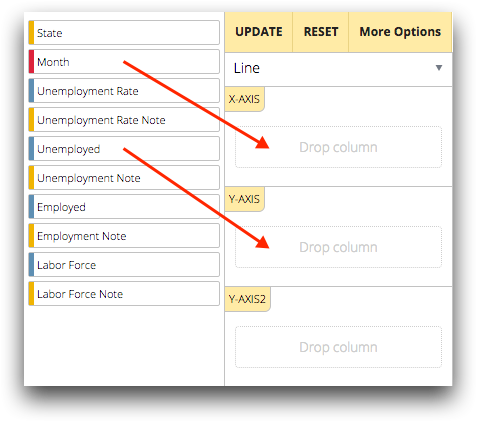
In the following example, if you wanted to plot the values associated with the column heading Month along the X-axis, you would drag that column into the Drop column area under the X-AXIS section in the chart parameters panel. If you wanted to plot the values associated with the column heading Unemployed along the Y-axis, you would drag that column into the Drop column area under Y-AXIS.