
Trillion-Row Spreadsheet
The Trillion-Row Spreadsheet (TRS) allows you to visually interact with your data.
The 1010data Insights Platform gives you several options to interact with the system and analyze your data, but when you first get started, you are likely going to spend most of your time in the Trillion-Row Spreadsheet. The TRS is a browser-based web interface that works similarly to many spreadsheet applications, such as Microsoft Excel. The interface uses many elements you may already be familiar with, such as folders, navigation icons, and menus.
The Trillion-Row Spreadsheet is accessed by selecting from the workspace menu.
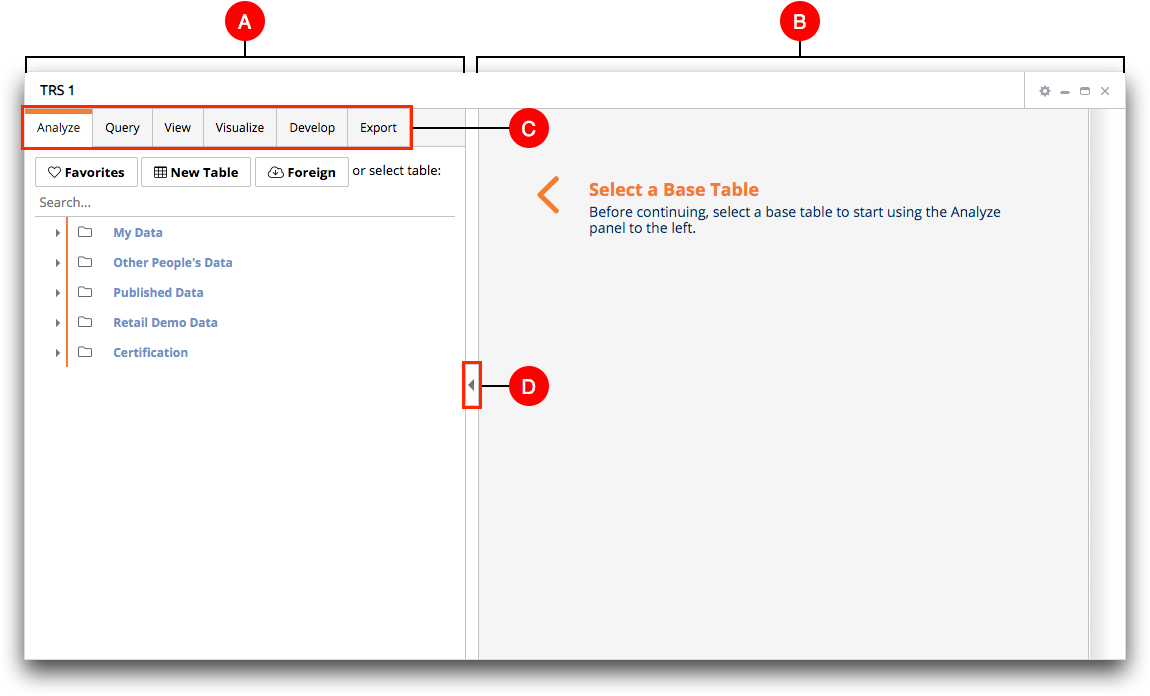
- A. Analysis pane
- The analysis pane occupies the left side of the TRS window. This pane is used to perform an analysis on your data.
- B. Results pane
- The results pane is displayed on the right side of the TRS window. This pane displays the results of your analysis in spreadsheet format. In addition, this pane also displays charts created in the Visualize tab.
- C. Tab bar
- The Tab bar contains the options used to perform an analysis and other actions on your data.
- D. Hide/Show
- To hide the analysis pane, click the Hide (
 ) icon on
the right side of the pane. This is helpful when you need more space to view your data
in the results pane. Click the Show (
) icon on
the right side of the pane. This is helpful when you need more space to view your data
in the results pane. Click the Show ( ) icon to
reveal the analysis pane when it is hidden.
) icon to
reveal the analysis pane when it is hidden.
| Tab | Description |
|---|---|
| Analyze | In a new TRS window, this tab displays options for opening objects such as tables and queries. After an object is opened, the Analyze tab displays the Analysis Timeline which provides quick access to perform operations such as summaries, tabulations, and cross tabulations. |
| Query | The Query tab displays the current timeline query as Macro Language XML code. It also provides the ability to undo and redo operations in the timeline. |
| View | Use this tab to select from among the various ways to view and interact with the data resulting from your analysis. |
| Visualize | Create charts based on your data analysis. |
| Develop | This tab allows you to save your query and provides options to further develop your analysis. For example, you can clone the Trillion-Row Spreadsheet and explore different scenarios without losing your original query. |
| Export | Export options to save the results of your analysis in a variety of file types such as CSV and Microsoft Excel. |