
Dashboard
Quickly access workspace and session information.
The Dashboard opens each time you log in to a new session or open a new workspace. It is divided into tabs that provide log in information, announcements, and the status of virtual memory used in your session. In addition, you can access recent workspaces and your favorite objects.
The Dashboard can also be accessed by selecting from the workspace menu.
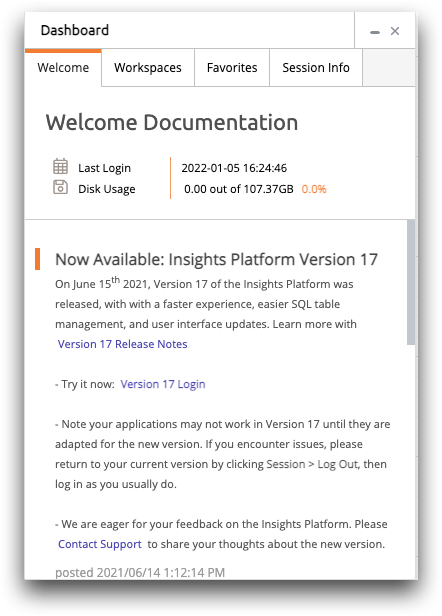
- Welcome
- This tab lists your previous log in information and indicates how much space of your
total disk quota you are using.
The Announcements section contains recent announcements from 1010data pertaining to system-wide changes and updates. It may also include more specific information about your data, queries, and so forth.
- Workspaces
- This tab lists your 10 most recent saved workspaces.
- Favorites
- This tab lists your favorite objects such as tables, folders, and queries. You can add favorites in the Object Manager. For instructions, see Add an object to your favorites.
- Session Info
- This tab allows you to monitor your virtual memory usage and to clear your cache.