Start with a 1010data query
Let's start off by building a query using 1010data's Trillion-Row Spreadsheet interface.
For our example, we'll use a Sales Detail table (retaildemo.salesdetail) that contains billions of rows of transactional data, and we'll incorporate information from a Product Master table (retaildemo.products) that contains detailed information about all of our products.
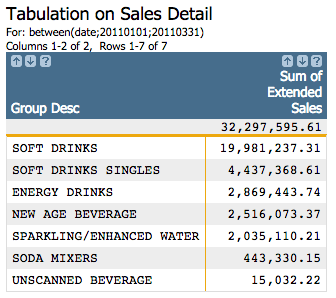
Let's say we want to calculate the total sales from 01/01/2011 to 03/31/2011 for items in department 19 and we want to group the results by the values in the Group Desc column of the Product Master table. So, our results would look something like:
To do this in the 1010data web interface, it would take just a few simple steps.
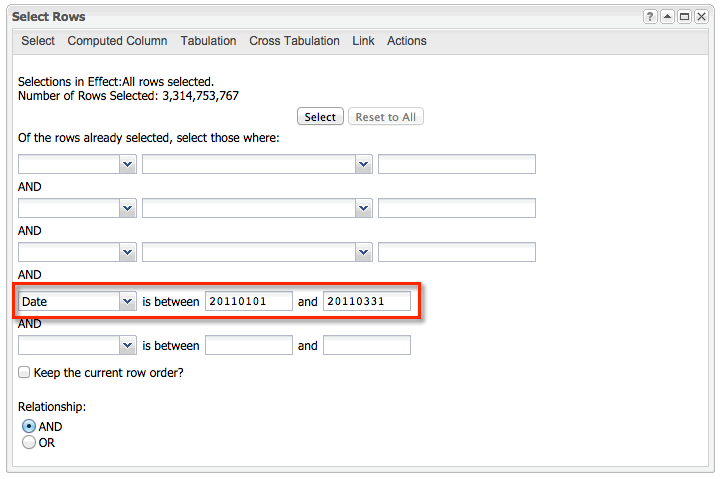
We'll start by selecting those rows in the Sales Detail table whose values in the Date column fall between 01/01/2011 and 03/31/2011:
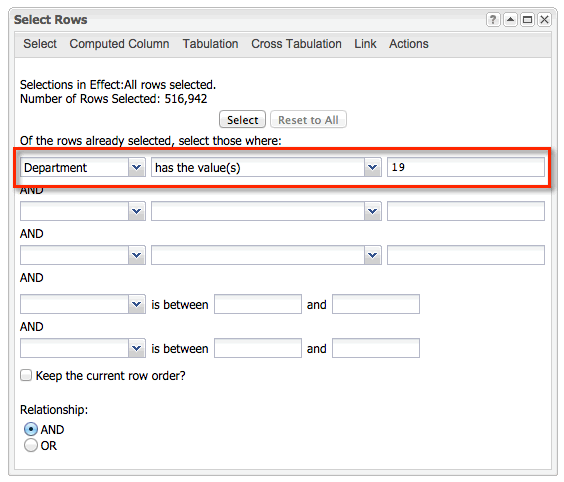
In the Product Master table, we'll select those rows whose Department is 19.
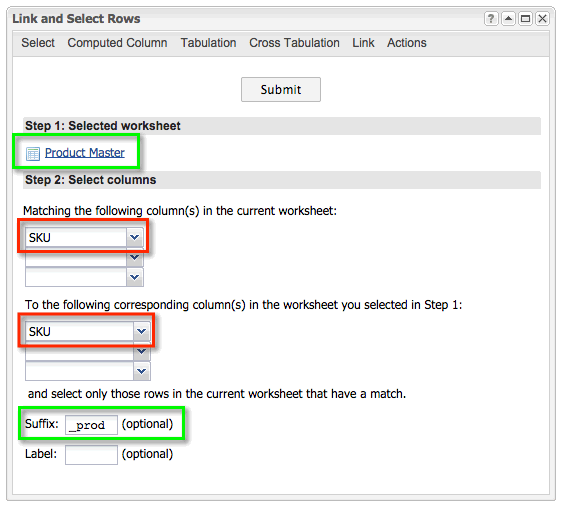
In the Sales Detail table, we can then use the Link and Select dialog to link in only those rows we just selected in the Product Master. We'll use the SKU column in each of the tables as the linking column, and we'll add the suffix _prod to those columns from the Product Master table:
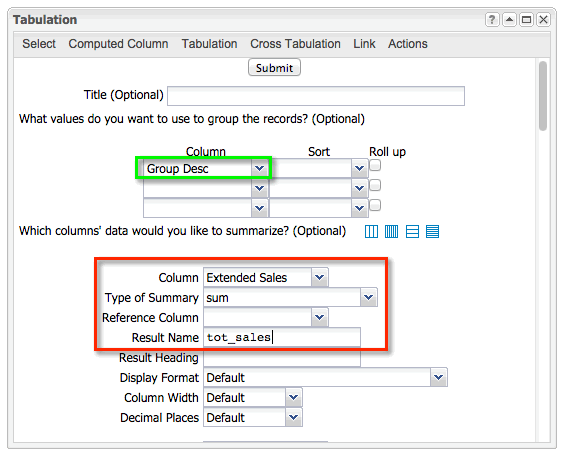
Finally, in the Sales Detail table, we can use the
Tabulation dialog to compute the sum of extended sales
(tot_sales), grouping by the values in the Group
Desc column:
Click to see the Macro Language code for our query:
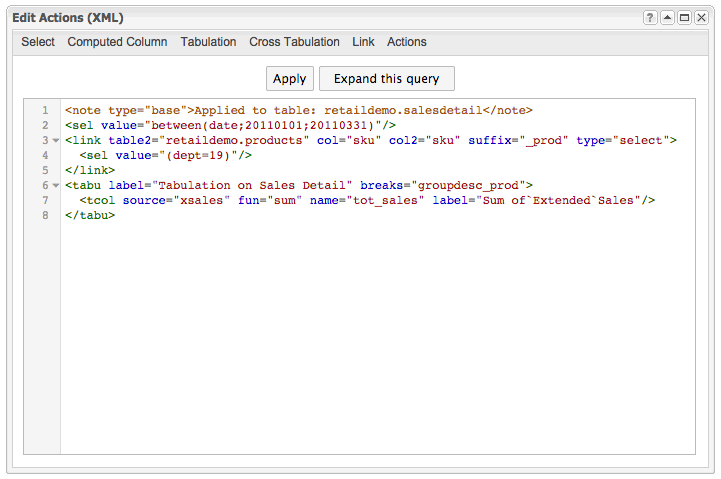
We can then copy and paste this Macro Language code directly into the 1010data Excel Add-in.
