
Manual handling of missing or invalid values
The 1010data Insight Platform's built-in N/A handling often provides satisfactory results, but there are cases where it makes sense to deal directly with N/As or invalid values.
These are some that are commonly used techniques for dealing with N/A or invalid values (i.e., values that are outside an expected range or have other problems).
Discarding Bad Values
The most obvious technique is to select only rows which have no bad (N/A or invalid) values before doing further analysis. For example, using the Select rows panel:
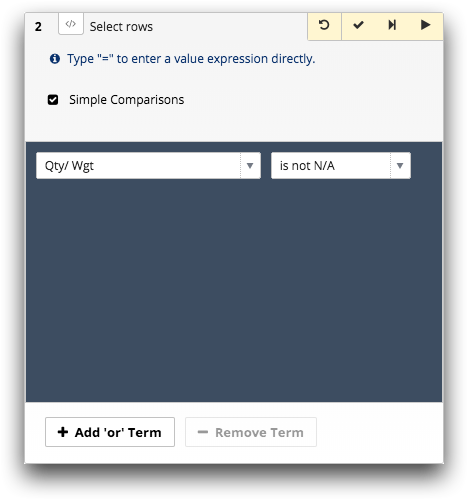
In Macro Language code, you may also use NA in the selection
expression. For example, quantity<>NA.
Discarding all bad values has the advantage of simplicity and may work well with databases with relatively few such values, but it may not always be the best thing to do. Consider the case where a computation is performed using five columns. If, on a particular row, even one of those columns has a bad value, you will be throwing out the entire row and losing the good values of the other four columns. In some cases, in fact, you could be throwing out the more important data just because you are missing some less important data.
Fixing Bad Values
Instead of throwing out good data, it may be possible to "fix" the bad data so that the analysis can be completed using as much information as possible. Specifically, it may be possible, using computed columns, to replace many of the bad values with plug values or values derived from other columns. Take the following table:
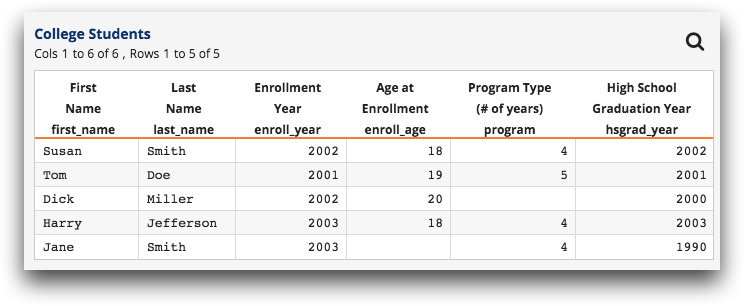
Note that there are two pieces of information missing.
Suppose we want to answer the following question: What will be the average age of a student
upon completion of his or her program? This is a simple enough calculation. First, define a
computed column, grad_age, that gives the required age for each
student. The value expression for this column is simply:
enroll_age+program. Then use a quick summary to get the average for
grad_age.
Let's see what happens when we do this. First we add the computed column:
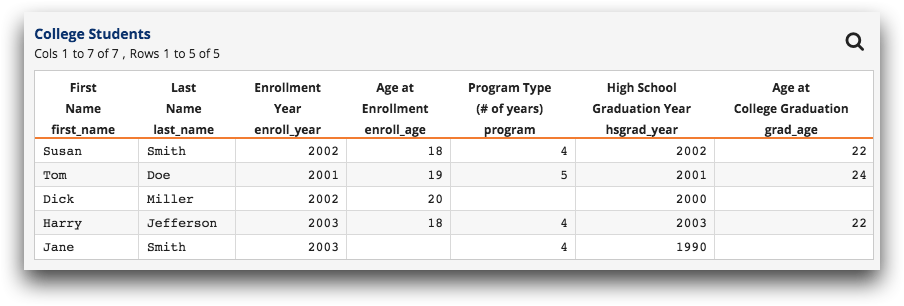
Because we were missing some information, two of the five results are N/A. This doesn't bode well, but we push on. Taking the average of the new column gives a final result of 22.7 years.
Can we do better? Well, consider that most college students are enrolled in four-year
programs. (Let's assume this is a four-year college.) We will probably not be very wrong to
assume that Dick Miller is enrolled in this type of program as well. So it would make sense
to "fill in" the blank with 4. How do we do this? One way is to add a computed column called
adjusted_program with the value expression:
if( program<>NA ; program ; 4 )In other words, adjusted_program will have the same value as
program unless program is N/A, in which case
adjusted_program will have the value 4. Applying this to the original
table gives:
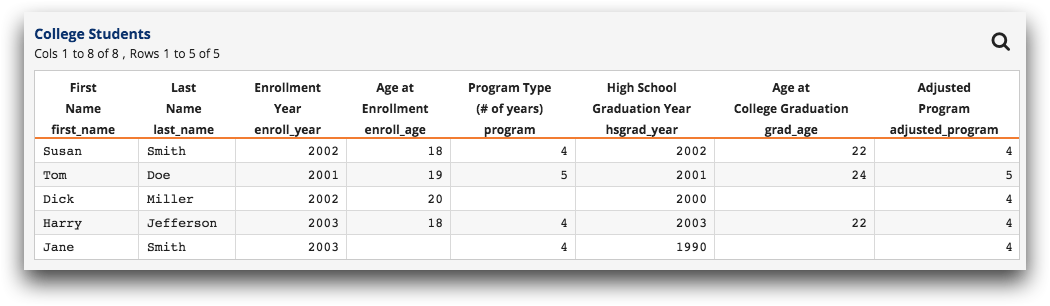
We have thus effectively filled in one of the missing values with a reasonable plug value.
How about the second missing value? It would be a shame to discard the data for Jane Smith,
since she is clearly an older student. Ignoring her would give a distorted final
result. Fortunately, we can apply another good guess to further clean the data. While people
enroll in college at all sorts of ages, most people graduate high school at around age
18. (There are exceptions, of course, but suppose we know enough about this subject to feel
comfortable with that assumption.) Given that we know when Jane graduated from high school
(1990) and enrolled in college (2003), we can make a pretty good guess that she was 31 when
she enrolled in college (31=18+2003-1990). So let's add a another computed column,
adjusted_enroll_age, with the value expression:
if( enroll_age<>NA ; enroll_age ; 18+enroll_year-hsgrad_year )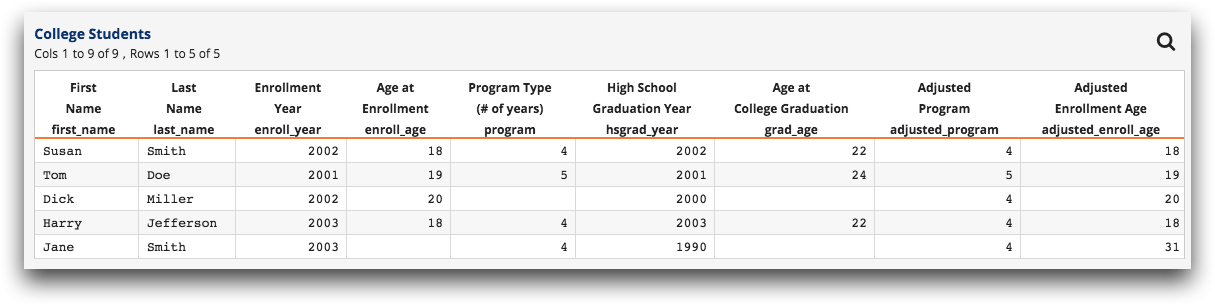
Now that we have essentially filled in all the missing values, let's get back to our
original question: specifically, what will be the average age of a student upon completion
of his or her program? As before, we will add a computed column,
adjusted_grad_age, that gives the required age for each student, but this
time we will use columns adjusted_program and
adjusted_enroll_age instead of program and
enroll_age. The value expression for this column is:
adjusted_enroll_age+adjusted_program and the result is:
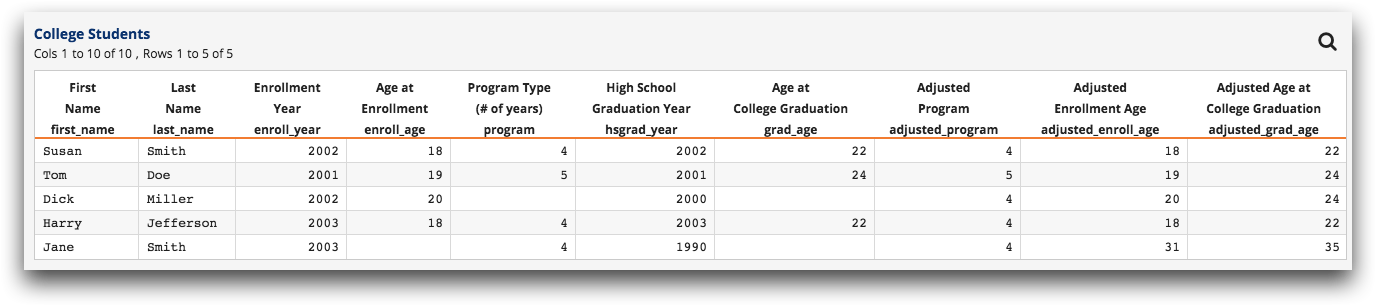
Finally, we get the average for the last column and come up with 25.4. Compare this to the 22.7 that we got earlier and note that this is probably a more accurate result even if our assumptions aren't perfect. Even if, in reality, Dick is enrolled in a five-year program and Jane was 17 or 19 when she graduated high school, our new result of 25.4 is closer to the truth than 22.7 was.
Of course, it isn't always possible to fill in missing data, but when it can be done, it can be quite beneficial or even essential.