
Session Info
Get information about the memory used during your session, including accumulator memory and subprocess memory.
Session Info is accessed by selecting the Session Info tab in the Dashboard. You can also access it directly from the workspace menu by selecting .
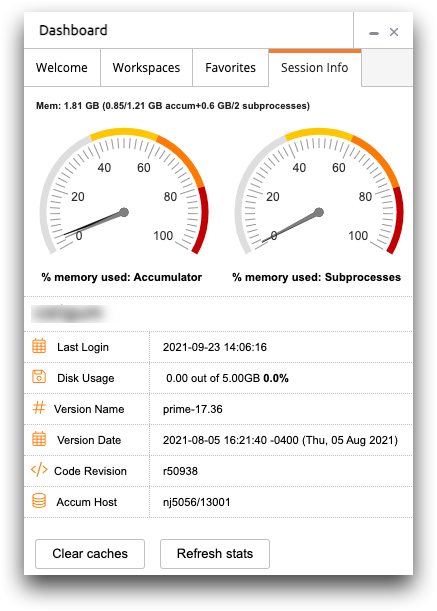
- % memory used: Accumulator
- The accumulator dial displays a gray and a black pointer.
The gray pointer represents the percentage of accum memory currently in use by objects such as code, working memory, temporary tables, tabulations, state cache, block code cache, dynamic cache, etc. When you clear the cache, the percentage of accum memory currently in use is reset (not to zero, since some things, like dynamic cache, are persistent). These percentages are translated into absolute numbers above the dials.
The black pointer represents the high-water mark, or the maximum percentage of accum memory used at any point during the current session. This percentage never goes down during the session, even if you clear the cache. The high-water mark represents the actual memory that the system has allocated to your accum, and is therefore not available to other users. If the black pointer reaches 100%, you will receive a wsfull error. - % memory used: Subprocesses
- The subprocesses dial also displays a gray and a black pointer.
The black pointer displays the overall percentage of the aggregate memory usage over all subprocesses. When you clear the cache, all your subprocesses are killed, and the dial resets to zero. The absolute memory usage of the subprocesses and the number of subprocesses are displayed above the dials.
The gray pointer displays the percentage of memory used on a server with the highest usage.If either pointer starts to approach 100%, there is a risk of running out of memory, and you should clear the cache if possible.