
Finished queries
The Finished queries view of the PPA allows you to view performance statistics associated with the completed queries from which data was fetched.
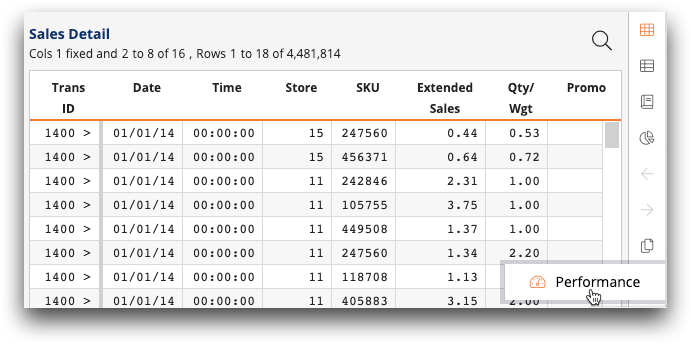
You can also access the Finished queries view of the PPA from TRS or
from MLW. After you run a query in TRS or MLW, click the Performance
( ) icon to view
performance information for your query.
) icon to view
performance information for your query.
- Find by base table
- Select a base table from the drop-down list.
- Total time threshold
- Select a query by time threshold. This is helpful if you want to focus on slower queries.
- Find by raw query text
- Enter text that is in the query.
- Arrow keys
- Browse through the queries that have completed.
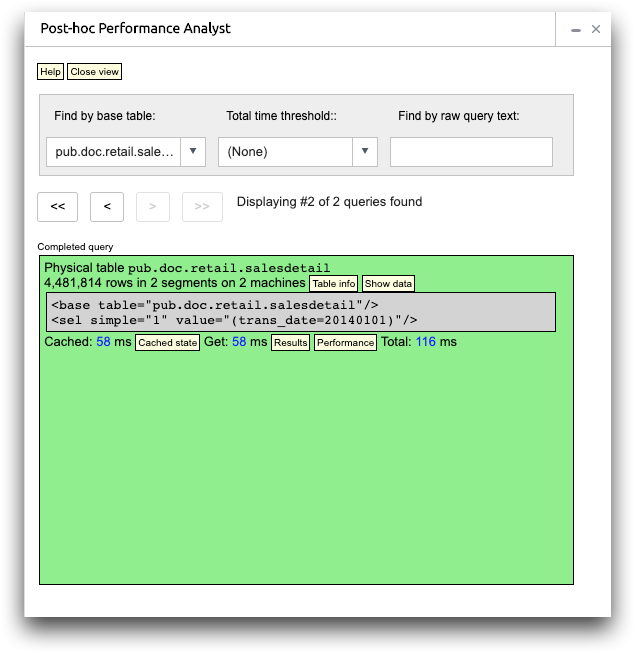
- Completed query
- This section shows details about the completed query, including the following information.
- Whether the table is physical or temporary
- The name of the table
- The total number of rows of the table
- The number of segments (physical tables only)
- The number of machines (physical tables only)
- Click Table info for a more detailed breakdown of machine names and segments (physical tables only). See Physical tables for more information.
- Click Show data for the actual table data. You can then open the table in TRS, if desired.
- The query itself
- Click Cached state to view the MDB state cache (ops yielding a cached state only). See MDB state cache for more information.
- Click Results for detailed data retrieval statistics. You can export the result set to TRS.
- Click Performance for a performance details view. This view includes query coordination at accumulator and query execution performance. You can export raw performance data to TRS.