
Tag Inspector
The Tag Inspector allows you to inspect the tags in the currently-running QuickApp and is a useful debugging tool.
The Tag Inspector contains a "scope" widget pointed at the currently-selected QuickApp tag.
The Tag Inspector is accessed by selecting from the menu bar. Alternatively, you can launch the Tag Inspector from
the results pane of a QuickApp in Macro Language Workshop by clicking the Tag
Inspector ( ) icon.
When you first launch the Tag Inspector, the following screen appears:
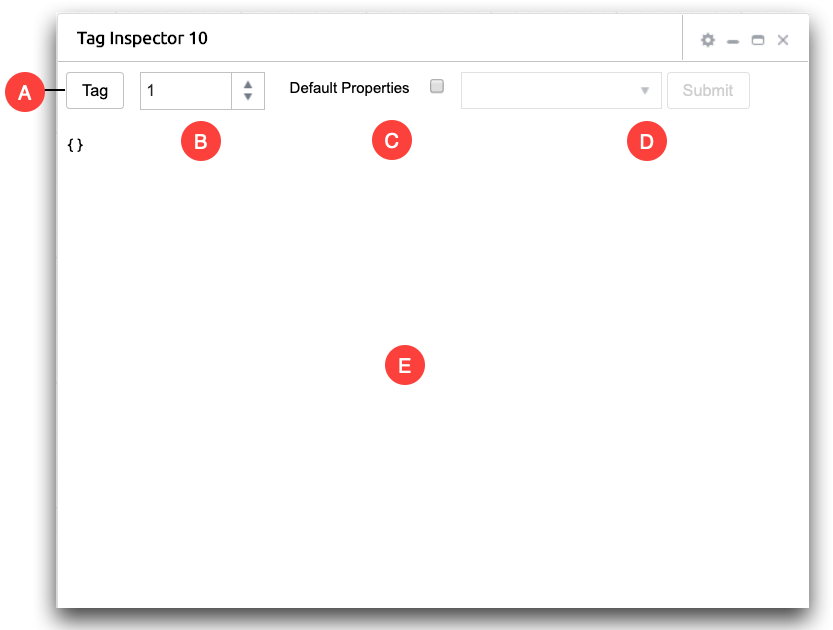
- A. Tag
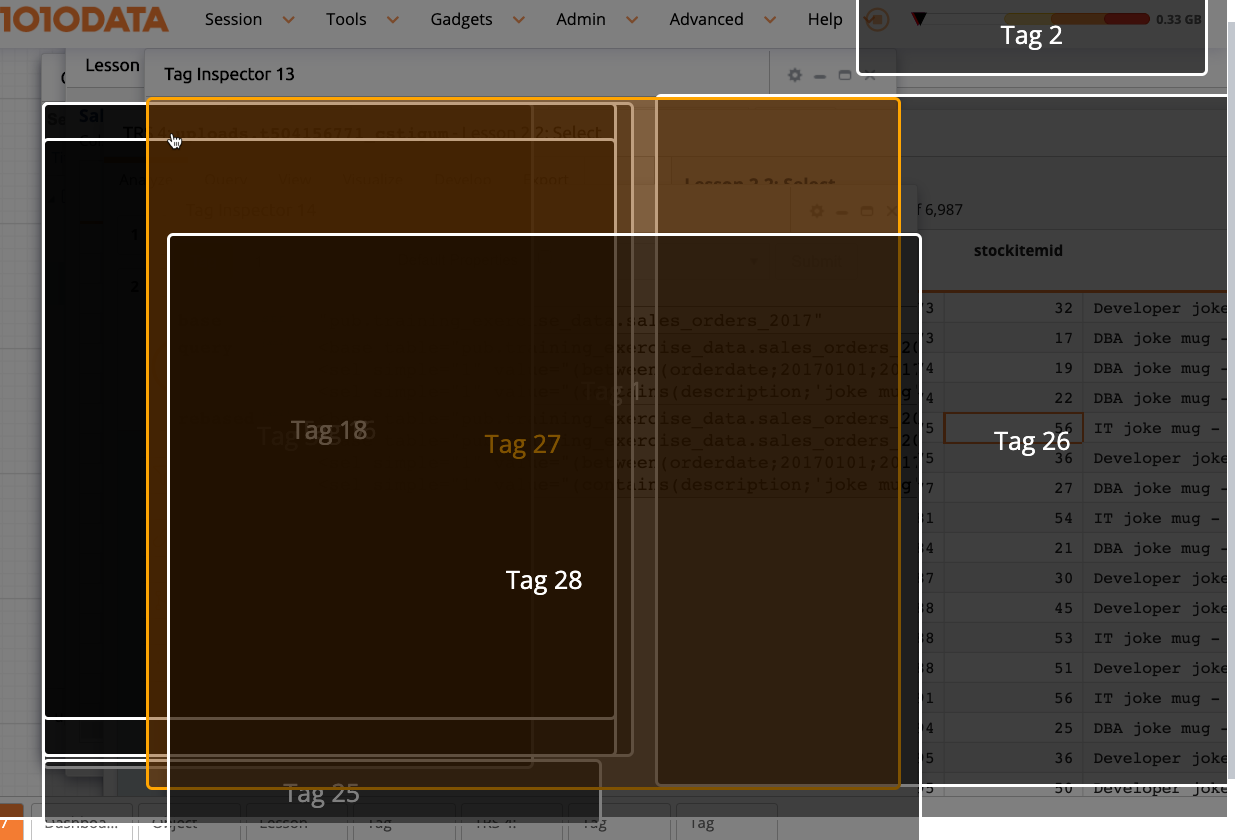
- Click this button to select a tag. When clicked, the Tag Inspector visually shows the tags as overlapping rectangles in your workspace. The borders of the selected tag are highlighted, as well as the number of the tag. In the image below, Tag 27 is selected.
- B. Tag selector
- Use the up and down arrows to locate the desired tag to inspect, instead of using the Tag button. Click the return key to view the tag details for that numbered tag.
- C. Default Properties
- Select Default Properties if you wish to display all
relevant system variables. This is the equivalent of
gui20_="1"in thescopewidget. - D. Drop-down and Submit
- Depending on the tag, there may be options to select from the drop-down list. Select the option, such as clearcache, and click Submit.
- E. Tag contents
- The remainder of the screen contains a list of the properties and contents of the tag.
The following is a Tag Inspector window for a simple QuickApp:
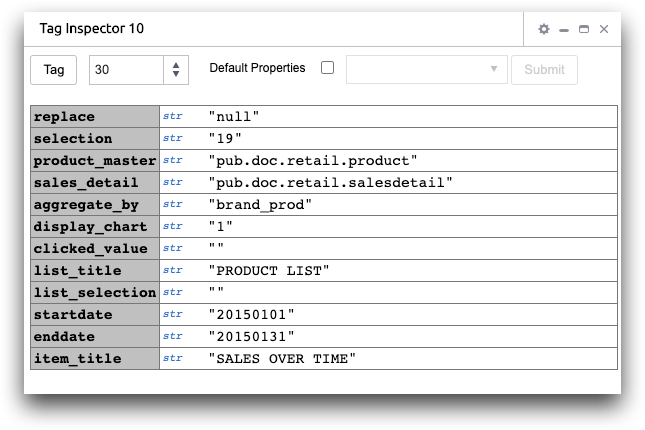
You can interact with the Tag Inspector and change values.