
View
Select among the ways to view and interact with the data resulting from your analysis.
By default, the results from your data analysis are displayed in the grid inside the results pane. You can choose to view the data in different formats, some of which also provide additional ways to interact with the data.
You can also select a view from the View bar in the analysis pane of the Macro Language Workshop. For more information, see View bar.
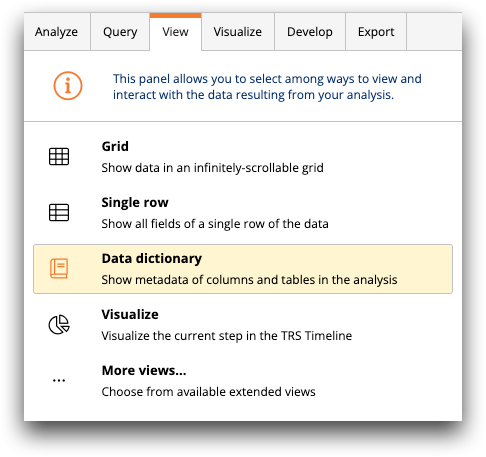
- Grid
- Displays data in an infinitely-scrollable grid. This is the default view.
For more information, see Grid view.
- Single row
- Displays all fields of a single row of the data arranged vertically. This view is
particularly useful for viewing information in a table that has many columns.
For more information, see Single-row view.
- Data dictionary
- Displays the metadata of columns and tables in the analysis.
For more information, see Data Dictionary.
- Visualize
- Displays the Visualization view for the current step in the timeline.
- More views
- Displays the extended views available to you.